Download
1 / 12
120 likes | 224 Views
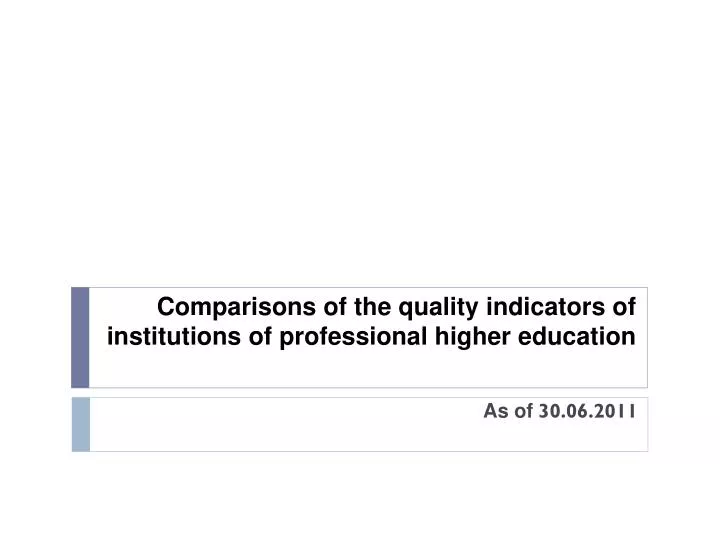
Comparisons of the quality indicators of institutions of professional higher education. As of 30.06.2011. Collection of data. On agreement, 7 indi cators were compared Drop out rate of first year students General drop out rate Filling state commissioned student places

E N D
Comparisons of the quality indicators of institutions of professional higher education As of 30.06.2011
Collection of data On agreement, 7 indicators were compared • Drop out rate of first year students • General drop out rate • Filling state commissioned student places • Outwards student mobility (Erasmus) • Inwards student mobility (Erasmus) • Students per lecturer • Qualification of the academic personnel Each school entered their data into a table located in the google.docsenvironment – the respective school is responsible for the availability and the authenticity of the data
Abbreviations of the names of the schools (According to SHE)
Drop out rate of first year students % of the enrolled students Analysis of the academic year 2010/11 can be conducted at the end of September (due to methodology, September 30 is deemed the end of a period) High drop out rate – EITC Upward trend EITC and TPC (reasoning is related to introduction of SIS) Significant fluctuations in EAA, UAS, health care colleges Average drop out rate of first year students in institutions of professional education in the academic year 09/10 is 13 % Average 13%
General drop out rate % of the amount of the students Upward trends in EITC, EAA, EASS, TPC, EUAS Negative trend (decrease of drop out rate) ENDC Average drop out rate in institutions of professional higher education in the academic year 2009/10 was10,1% Average 10,1%
Comparisons of drop out rate with the average in the academic year 2009/10 Drop out rate of first year students General drop out rate Average 13% Average 10,1%
Filling of state commissioned student places (SCSP) Percentage of graduates (SB+NSB) upon of the completion of the nominal study period Problems may emerge on calculation of filling of state commissioned student places in the schools where the curricula are of different lengths (e.g. THCC)
Student mobility (outwards through) Percentage of the students The number of mobile students
Students mobility (Erasmus, % of students) academic year 2009/10 academic year 2010/11
Students per lecturers Students per an ordinary lecturer The problem is a lack of basis of calculation of a full work load
Students per lecturer Both ordinary and guest lecturers have been taken into account (as November 2009 and 2010) In the future, the need to introduce analysis into the calculation of full time work
Qualification of the academic personnel % from the number of ordinary lecturers on the basis of the data of 2010 (10.11.2010) except ENDC and health care colleges Diploma C – qualification between the Master’s and the Doctoral degree – a professional Master’s degree or a research Master’s degree