Download
1 / 33
330 likes | 398 Views
This presentation will probably involve audience discussion, which will create action items. Use PowerPoint to keep track of these action items during your presentation In Slide Show, click on the right mouse button Select “Meeting Minder” Select the “Action Items” tab

E N D
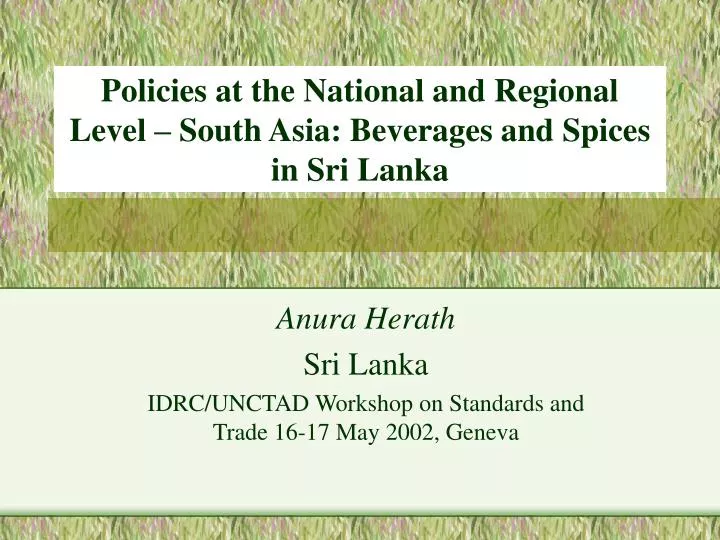
This presentation will probably involve audience discussion, which will create action items. Use PowerPoint to keep track of these action items during your presentation • In Slide Show, click on the right mouse button • Select “Meeting Minder” • Select the “Action Items” tab • Type in action items as they come up • Click OK to dismiss this box • This will automatically create an Action Item slide at the end of your presentation with your points entered. Policies at the National and Regional Level – South Asia: Beverages and Spices in Sri Lanka Anura Herath Sri Lanka IDRC/UNCTAD Workshop on Standards and Trade 16-17 May 2002, Geneva
Status Summary: Spice & beverage Sector Production Land - 53,000 ha (9% of total) Farms: 250,000 Av Size: 1/4 ha About 20%-50% HH income National Economy GDP - 0.57% Tot. FE (5600 Rm):1.75% Agric. FE - 8.5% Sector Environment Biodiversity Land degradation Socio-Economy/Technology Labour intensive High women participation All local inputs
Progress of the Sector [1980-2000] Sector has progressed There is a tremendous potential in the world market Global Scene Imports (mt): 220,000 - 500,000 Growth Rate: 3-4% Per capita spice consumption: 2.33 - 3.19 Local Scene Area (ha): 30,240 - 53,600 Foreign Exchange (US $ mn): 6.4 - 69.7 Exports (mt):10,300 - 17,900
Markets for SL Spices & Beverages • Cinnamon: USA – 10%; Mexico – 44% • Cardamom: Singapore – 21%; UK - 5%, South Africa; Bangladesh • Clove:India – 26%; Saudi Arabia – 15%; UK – 7% • Pepper: UAS – 10%; UK – 11%; India – 25% • Coffee : UK – 5%; Italy – 9%; Austria – 12%, Germany – 23% • Cocoa: UK; Germany; Italy
Increase in market access Cardamom = 8% Clove = 22% Pepper = 18% Coffee = 17%
Quality Requirements u SF= 4,5,6,7: 1-5% insect or infected pieces
Percentage of Product Volume with High Moisture Level and Mould at the Exporter Level National level survey of 350 traders
Main reasons for low quality • Improper harvesting • Unfavourable drying systems. Nearly 70% of the producers use sun drying on home yard with no proper surface for drying. Roadside drying is common. • Experience frequent rain during the harvesting period. About 69% of producers claimed the problem. • Only 5% of the producers use a mechanical dryer. • About 64% reported of poor storage.
Estimated Proportion of Products with Substandard Quality and the Reprocessing Cost to meet SPS Requirements
Loss of Exportable Volume & the Corresponding Value(OV = opportunity value: Ex. Price – FG price)
Loss of FE due to non compliance • Loss of prices: Average FOB price is 41% less than the average world market price for coffee, 34% for cocoa, 20% for pepper, 69% for nutmeg and 30% for cardamom. This difference, according to the exporters, is mainly due to non-compliance • Volume loss at the retail trade level: If the quality is in line with SPS requirements, this volume could have been exported at about US $ 2.2 million per year • Value loss at the exporter level due to lack of quality: There is a reprocessing cost of about 0.7 million US $ per year. This will reduce the competitiveness. • In total the estimated value of foreign exchange loss due to non-compliance is US $ 2.9million / year: about 5% of the total FE earnings from spices & beverage crops
Overall Impact – What Policies? • Overall impact on country’s GNP • Negative impact on poverty alleviation • Permanent loss of markets Policy Interventions
Basis for Policy Directions (understanding the sector) • Small Size of the cultivation • Heterogeneity • Low capital and low credit – low investment • Subsistence nature – poverty issue • Information gap – basically government sources: GOSL cannot reach the base for lack of funds
Basis for Policy Directions (understanding the sector) • Small Size of the cultivation • % marketed in the domestic market • Considerable • hence total production meeting the cost of compliance may not be cost effective for the small scale producers • The price gab between Grade 1 & 2 is inadequate for high investment • Pepper – 7-10%; Cinnamon – 10-15%; Coffee – 5-8%
Basis for Policy Directions (understanding the sector) • Small Size of the cultivation • % marketed in the domestic market • Awareness • There is a considerable gap in time & precise information: • producer – exporter • Exporter – consumer • Gap between the national inquiry points & producers • Government information sources are less efficient due to lack of resources
Percentage of Trading Partners at Different Points of the Trade Channel who have Reported the Inferior Quality of Spices Information Gap
Well planned training programme is needed • There are about 70,000 traders involved in the industry • The total cost then would be in the range of US $ 1.954 million • The annual budget allocation is US $ 24,400, which is only 3% of the requirement
Basis for Policy Directions (understanding the sector) • Small Size of the cultivation • % marketed in the domestic market • Awareness • Cost of Production • Less competitive & thus cost increase is not attractive
Basis for Policy Directions (understanding the sector) • Small Size of the cultivation • % marketed in the domestic market • Awareness • Cost of Production • Technology • Not in line with giving high quality
Summary • The sector is important for FE earning and poverty alleviation • Improved market access is only marginal if SPS requirements are not met, so emphasis on quality is essential • There is a notable cost in complying with standards • Quality is affected by weather, technology and knowledge factors • The policy interventions should take the basic features of the sector.
Policy Direction for Sri Lanka • Increase awareness in lowering cost of production and increasing quality. • Encourage central processing and out-grower systems • Emphasise on the possibility of exchanging improved genetic material and plant varieties which help in increasing competitiveness • Increase facilities for national inquiry points • Improve the capacity to detect and eliminate contaminants, to process spices to acceptable standards, and proper packaging etc. • Encourage capacity building on HRD • Develop strategies, may be collectively with other DC, to take Technical Assistance under SPS measures through a close consultative process with all the stakeholders • Provide state assistance to central collection and processing points to maintain the homogeneity of quality. • Encourage regional co-operation through producers’ meetings