Download
1 / 22
220 likes | 326 Views
Closing the Achievement Gap : Using Mileposts for Intervention Strategies. Presentation Focus: Administrators and Teachers Who are you? User Experience Personal Experience: Results Set the Tone Look at the Data: Make it pop Achievement Data: Big Picture to Small Picture Fall Goals

E N D
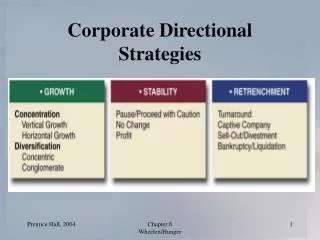
Closing the Achievement Gap: Using Mileposts for Intervention Strategies
Presentation Focus: Administrators and Teachers • Who are you? User Experience • Personal Experience: Results • Set the Tone • Look at the Data: Make it pop • Achievement Data: Big Picture to Small Picture • Fall Goals • Spring To Spring Growth • Comparison: Teacher to Teacher • Individual Students • Training and Recall • Setting up Learning Goals • Advanced Filtering and List Manager • Monitoring Plans and Interventions
Recognition Learners of the Month Four positives to every negative Reinforcing Positive Behavior Excellence in LEP Instruction Catch kids doing Good Things
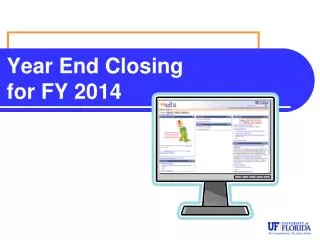
ISAT Testing Getting ready for next year
Looking at Data 2004-2011: LEP: 2003-04: 7% 2010-2011: 22%
Intervention Decisions Based on Data and Discussion Math P & A % Data shows: What trends did we identify and Foresee? • “Basic Math” classes had flat growth levels • Highest achieving students had minimal growth • Huge Achievement Gap in Sub Categories • Demographics were going to change radically in the next five to seven years with 3-5x growth in Hispanic and ESL
What changes did we make because of the data trends we found?
Reflecting On Data: Misconceptions and Faulty Perceptions VS. Disaggregating, Trending and Drilling Down
Big Picture Small Picture
Disaggregating the Data to the Smallest Picture: Individual Students Bad Teacher? Amazing Teacher? Missed two questions: 7th Grade Perfect Score 6th Grade
ISAT Math Percentages of Proficient and Advanced 2004-2011
ISAT Reading Percentage of Proficient and Advanced 2004-2011
Medium Picture: Classroom by Classroom Fall Teacher Goal Sheets
Data Straight from Mileposts – You just use Fill-in Color Medium Picture: Classroom by Classroom Critical need for support and/or remediation – Below Proficient or Low Proficient
Spring to Spring Growth Changing Levels of Proficiency Gaining on AYP in the P&A %
Big Picture: Whole School Teacher by Teacher Decisions Based on what the Data Illuminates ☠
Biggest Picture District and State Looking at Cohort Data Math ISAT Data 2009-2012 Why the decline in 7th grade?
Biggest Picture District and State Cohort Data ISAT Reading Data 2009-2012 Seeing Steady and continuous growth
Advanced Filtering and List Manager Building Goal Sheets Monitoring Plans and Interventions Take Away Tips Screen Casts to Help You After the Session