Download
1 / 19
190 likes | 381 Views
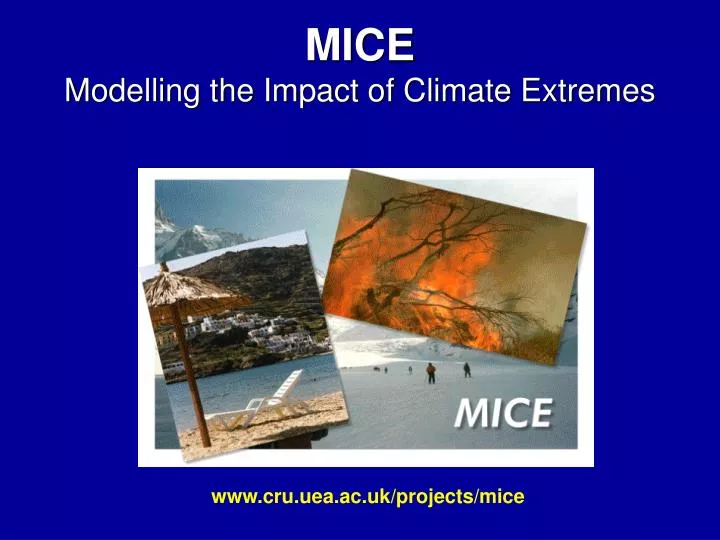
MICE Modelling the Impact of Climate Extremes. www.cru.uea.ac.uk/projects/mice. HadCM3 land gridbox. Selected landmass. Other land areas. The MICE study area. MICE has six work packages: (a) Analysis of extremes in model data. Extraction of climate extremes for analysis

E N D
MICEModelling the Impact of Climate Extremes www.cru.uea.ac.uk/projects/mice
HadCM3 land gridbox Selected landmass Other land areas The MICE study area
MICE has six work packages:(a) Analysis of extremes in model data • Extraction of climate extremes for analysis • Time series characteristics of extremes under climate change • Spatial patterns of extremes under climate change (b) Impacts evaluation • Quantitatively modelling impacts of changes in climate extremes on activity sectors • Expert-judgement based approaches to understanding impacts of changes in climate extremes on activity sectors • Co-ordination and dissemination
Types of extremes to be analysed: Temperature • exceedences of percentiles and fixed thresholds • highest TMAX and lowest TMIN Precipitation • exceedences of percentiles and fixed thresholds Wind • exceedences of percentiles and fixed thresholds • highest maximum and mean windspeed per year
Core data currently being used in MICE • Model Data • HadCM3 scenarios A1f, A2a, A2b, A2c, B2a, B2b • HadAM3H scenarios A2a, A2b, A2c, B2a (Early 2003) • HadRM3H scenarios A2a, A2b, A2c, B2a • variables include: • temp, tmax, tmin, mslp, prec, rhum, wind, wmax, tclw, dswf • “Observed” Data • NCEP Reanalysis data for the above variables, 1961-1990 • Indices of extremes have been extracted from the above, at all grid points, for further analysis.
Sample Analysis 1: PCA of monthly tmax from three models • data - monthly tmax from 1961-2099, using HADCM3, CGCM2, and CSIRO Mk2 data (A2 and B2 scenarios) • objectives – provide background climatology for extremes, using PCA to: • identify the main modes of variability • examine effects of different scenarios • identify inconsistencies in the models • All models give similar results in this PCA. • (Results courtesy of Tom Holt)
Factor 6 of the HADCM3 PCA, explaining 5.9% of the overall variance. A2 B2 This relatively unimportant factor would be expected to show differences between the scenarios. Yet the spatial patterns are almost identical. Conversely, the time series are quite different. This is typical for all factors.
Sample Analysis 2: The behaviour of extremes in HadCM3 and HadRM3H • data – daily 1961-1990, using HadCM3, HadAM3H (early 2003), and HadRM3H data (A2 scenario) • objectives – provide a better understanding of the behaviour of extremes (fixed thresholds and percentiles) prior to impact modelling. • results –models appear to simulate extreme temperatures relatively well in mid-latitude regions with mild winters and summers, but significant season-long biases are present at in polar and Mediterranean regions. • (Results courtesy of Matt Livermore)
Sample Analysis 3:Identification of Cyclones for the European Sector winter (=ONDJFM) • data – daily 1961-1990 and 2070-99, using HadCM3 (A2 and B2 scenarios) • objectives – provide a better understanding of cyclone behaviour and wind fields prior to impact modelling. • results –model appear to simulate too many weak centres and not enough deep cyclones – a scale issue. • (Results courtesy of Uwe Ulbrich - UKoeln)
1961-90 Example 1: “Closed Systems” withp < 1010hPa A2a (2070-99) – 1961-90 Unit: Cyclone days per month per 5x5 degree grid box
Sample Analysis 4: Forest Fires Typical high values for the above codes and indices. (Results courtesy of Marco Bindi – FMA)
These results apply to a single HadRM3 grid cell in Tuscany.
MICE over the next few months: Climate Model Analysis (1) • Time series characteristics of extremes under climate change • Complete validation of HadCM3 and HaDRM3 • Changes in extremes in model time • compare extremes for 1961-1990 with 2070-2099 • highest and lowest per year • three/four independent extremes above a threshold per year • analysis techniques for extremes • stationarity, trends, periodicity, return periods • clustering and Poisson processes • GEV analysis • GPD analysis
MICE over the next few months: Climate Model Analysis (2) • Spatial patterns of extremes under climate change • Map event occurrence for overlapping 10-year periods • Use PCA to identify major modes of extreme events • relate the modes to NAO and AO using regression • Use CCA to examine slp and 500 hPa height • Continue analysis of model and NCEP storm tracks
MICE over the next few months: Impact Modelling • Quantitatively modelling impacts of changes in climate extremes on activity sectors • Energy • Forest Fires • Insured Losses • Mediterranean Agriculture • Scandinavian Forests


![Grand Challenges in Modelling [Storm-Related] Extremes](https://cdn3.slideserve.com/5407470/grand-challenges-in-modelling-storm-related-extremes-dt.jpg)