Download
1 / 13
140 likes | 259 Views
Numerical Measures of Position. Standardization. With the x & s a clear picture of the distribution of a set of values is possible. Often, an individual value is of interest rather than the entire set of values. Standardization.

E N D
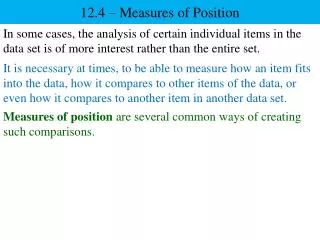
Standardization With the x & s a clear picture of the distribution of a set of values is possible. Often, an individual value is of interest rather than the entire set of values.
Standardization • Using the x & s, a standard score can be calculated. • Standardization allows for • the comparison of individual scores, • even those with different scales • Ex. The ability to compare the results of 3 different writing measures • Ex. Weights of an individual calculated in lbs and kg
Standardization and z Score Standardization is simply a transformation of a value to a linear standard score most frequently a zscore. A z score tells us how far a raw value is above or below (±) the mean of a distribution (the group of values). The distance is expressed using standard deviation units. Standard Score z = (x- x ) / s
z Score z = (x- x ) / s Ex. Ashley has two test scores on listening comprehension; Test A = 49 and Test B = 99. Test A = 49 Test A has a M = 44 and a s = 4. What would her standard score be for Test A? zA = (49- 44 ) / 4 = 5/4 = 1.25 Test B = 99 Test B has a M = 104 and a s= 3. What would her standard score be for Test B? zB = (99- 104 ) / 3 = -5/3 = -1.67
z Scores and Normal Curve zscores can be plotted on the Normal Curve. There is a direct 1:1 ratio between standard deviation and z scores. ± 1s = ± 1z ± 2s = ± 2z ± 3s = ± 3z
z Scores and Normal Curve z scores can be plotted on the normal curve Test A = 1.25 z Test B = -1.67 z M S -3 -2 -1 0 +1 +2 +3 z -3 -2 -1 0 +1 +2 +3
z Score Regardless of the scale, z scores remain the same Patients’ z scores remain the same even though the measurement scale changes Weight in kg Weight in lbs. Student x z x z A 48 -1.52 105.2 -1.52 B 52 -0.17 114.4 -0.17 C 54 -0.51 118.8 -0.51 D 60 1.18 123.2 1.18
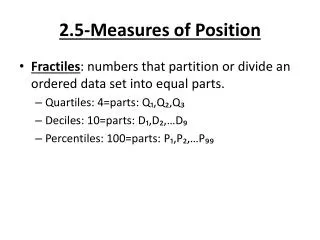
Percentile Rank Percentile ranks (%ile) are based on the percentage areas under the curve. A percentile rank (PRx) describes the percentage of scores in the distribution that fall above and below the given standard score. Ex. A value at the 65th percentile falls at or above 65% of the values in the distribution. A values at the 43rd percentile falls at or above 43% of the values in the distribution.
Percentile Rank The formula for Percentile Rank is as follows: PRx = B + 0.5fx 100 = n where B = number of values below x where fx = number of values equal to x With this measure, rank order is a must!!
Percentile Rank Shoe Sizes for a sample of 12 male students 13 11 10 13 11 10 8 12 9 9 8 9 What is the percentile rank for a shoe size of 12? Rank Order 8 8 9 9 9 10 10 11 11 12 13 13 PR12 = 9 + 0.5(1)X 100 12 PR12 = 79.17 A value of 12 corresponds approx. to the 79th percentile. 79% of the sampled male students have a shoe size of 12 or smaller.
Distributions Percent of values under portions of the normal curve 34.13% 34.13% 13.59% 13.59% 2.14% 2.14% 0.13% 0.13% S -3 -2 -1 0 1 2 3 M
Percentile Rank and Normal Curve Percentile Rankcan be plotted on the normal curve Size 12 = 79th Size 10 = 50th Size 11 = 67th M S -3 -2 -1 0 +1 +2 +3 z -3 -2 -1 0 +1 +2 +3 S -3 -2 -1 0 +1 +2 +3 z -3 -2 -1 0 +1 +2 +3 %ile 0.1 2 16 50 84 98 99.9