Download
1 / 30
300 likes | 515 Views
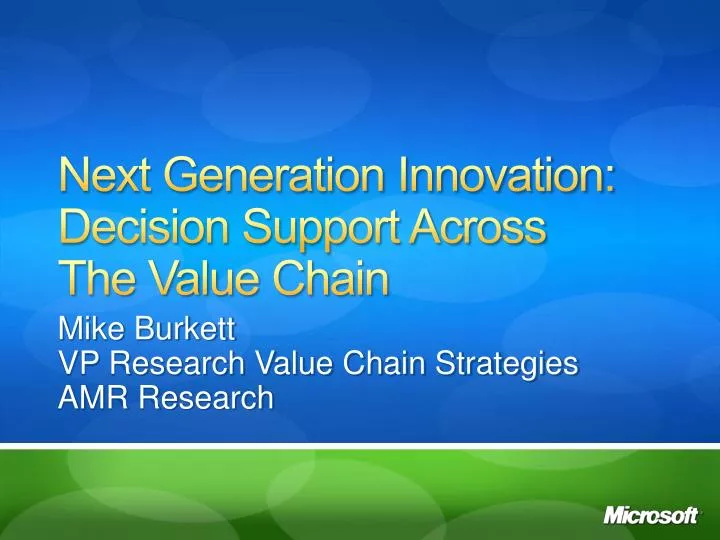
Next Generation Innovation: Decision Support Across The Value Chain. Mike Burkett VP Research Value Chain Strategies AMR Research. Driving for Continuous Innovation. Keith Dishno Industry Solutions Professional Product Innovation. Driving for Continuous Innovation.

E N D
Next Generation Innovation:Decision Support Across The Value Chain Mike BurkettVP Research Value Chain Strategies AMR Research
Driving for Continuous Innovation Keith Dishno Industry Solutions ProfessionalProduct Innovation
Driving for Continuous Innovation Kevin Burkett- AMR Research Vice PresidentPete ThompsonGeneral Manager - Surface Computing, MicrosoftHerman HarwellSenior Member, Global Operations Manufacturing Engineering Organization - Applied Materials
AMR ResearchAn independent company of experts who advise decision makers • Independence – We have no vested interest in the decisions to which we lend advice • On what? – We research the intersection of business process with supply chain and enterprise technologies • Since 1995, we have published close to 14,000 pieces of research and conducted over 10,000 primary interviews • For whom? – Operations and I.T. executives in the following industries • Manufacturing (13 of top 15 discrete manufacturers) • Consumer Products (16 of top 20 firms) • Life Sciences (13 of top 15) • Retail (14 of top 20) • How? – Through retained advisory services and peer networking forums
Agenda • Innovation business environment • Trends and priorities for success • Techniques and transformation stages
Innovation Is An Executive Concern • Qualcomm – Global Design Teams meet world demand • …added engineering teams …new groups will help us …provide complete system solutions to… worldwide marketplace.” (Letter to Stockholders - Qualcomm 2004 Annual Report) • Palm – New product delays impact stock value • "Uninspired product launches suggest a weak new product engine and have reduced Palm's differentiation …" he said in a downgrade of the stock issued Sept. 10. He said improvements wouldn't come for another 12 months. (Jeffrey Kvaal Lehman Brothers Holdings Inc. WSJ 09/19/07 “Palm Bets Big on New Phone”) • Procter & Gamble – External innovation fuels growth • …inventors are evenly distributed in the population…as likely to find invention in a garage as in our labs…(A.G. Lafley – CEO P&G, Fortune 05/04)
Evolving World Of Innovation • New approaches to improve R&D returns • Driving open innovation • Design outsourcing • Borderless innovation • Creativity applied in a business context • From Six Sigma DMAIC to CENCOR • Shift from brand manager to innovation manager • Anthropology and consumer insight • Product modularity and the risk of interfaces • From systems engineer to systems manager • Experimental learning, validation, and corrective action • Interdependencies shared across the supply chain
Challenges For Delivering Innovation • Contract manufacturing integration – (Microsoft, all high-tech) • Global design centers – (Qualcomm and Phillips) • Product lifecycle cost analytics – (Sony TVs) • Rapid introduction of more variants – (Dell and Nokia) • Software and electro-mechanical CM – (Sony Ericson) • Compliance/RoHS – (Sony PlayStation) • Portfolio Management and Optimization – (Micron, Sony Ericsson)
High Tech Margin Model Compete with innovation Capture market share & margins Compete on price Dollars Sell price Mfg cost Time
Top Reasons Why Product Launches Fail Late to market/missed demand 32% Pricing 31% Product quality 30% Doesn’t meet customer needs 30% Commercialization or promotion 22% No clear product differentiation 20% Inadequate distribution channel 17% Product availability issues 17% 15% Regulatory issues 4% Other Source: AMR Research, 2006
Measure ROA Intellectual Plant Inventory Market Success Growth- On-time- Reliability ROI R&D-Production- Marketing Forecast Supply Demand Availability • Market • Features • Pricing • Capacity • Flexibility • Quality Validate Competencies Specification Requirements Capability Product • Innovation • Options • Roadmap Voice Of the Customer Lean Supply Define Design Promote Supply Support PERFECT LaunchDemand driven supply networks Source: AMR Research, 2007
Innovation ExamplesEssentials for success • Customer focus • Intel switch from speed to application segments • Electrolux consumer insights and development teams • Capturing ideas • Google 20% employee time pursuing ideas • P&G Connect + Develop using innovation brokers • Joint value creation • XM and Samsung Helix portable satellite player in 9 mo. • IBM semiconductor innovation network • Speed right products to market • Nissan 21 now 10 mo. • Motorola 18 now 9 mo.
Research And Development Different processes • Exploration • Experimental • Iterative learning • Uncertainty • Exploitation • Execution • Controls • Less risk • 61% of profits • 14% of new products Source: Peter Koen, Front End of Innovation Conf. 2007. Blue Ocean Strategies, 2004
Focus On The Right Ideas • “the goal is to focus on few very bold ideas that tend to work, as opposed to many, many ideas all over the place that tend to fail.” (Larry Keeley, President Doblin Group BW 8/1/05)
Program/Product Portfolio Management • Project Dashboard and Portfolio Analytics • Platform Roadmap • Concept BOM’s and Designs • Align Customer Needs/Product Features • Requirements Management • Filter Ideas • Idea Management Fuzzy-Front-End Through Product Launch Customer Driven Input Idea Discovery Concept Feasibility Design Launch Internal / Technology Driven Input “Fuzzy-Front-End” of New Product Development
AMR Research Hierarchy Of Product Metrics New Product Forecast Accuracy Predictable returns to shareholders Strategic Benefit Innovation Benefits Innovation Investment Time to Value Capability to respond to market opportunity Time to Market Time to Breakeven Time-to-Value Design and Launch Planned vs. Actual Design Budget/ Sched. % Customer Needs Met Product Pipeline Manage Part and Process Reuse Stability of processes driving value Operational Excellence First Pass Yield Post Launch Planned verses Actual Mfg/Cycle Time New Product Detail Cost Detail Engineering Changes First Year Field Returns Source: AMR Research 2006 What it tells you
Open Innovation • Knowledge is everywhere • Customer, suppliers, brokers, universities • Alternative business models • Existing paradigms may not work best • Rethinking product strategy • Modular architectures, components, integral systems • The new role of product research • Knowledge brokers, system managers …win by making the best use of internal and external knowledge…combining…in new and different ways to create new products or services… Open Innovation, by Henry Chesbrough
CaseOpen innovation and joint value creation • Boeing 787 • Demand insight airline customers’ desire for fuel efficiency • 160 risk sharing design partners to develop the new aircraft. • Partners contribute light weight composites and electric drives • Cut 12 mo. off dev. time, 20% off cost, 25% improved efficiency • Three different configurations available based upon customer requirements
Collaboration Varies Across The Lifecycle Define Design Promote Supply Support • Adhoc discussion • Marketing • Eng. • Business Strategy • Ramp to volume • Finalize quotes • Continuousimprovement • Customer and channel feedback • Change/ Enhance • Develop collateral for launch • Mktg. • Eng. • Channel • Interactive design • Eng. • Manf. • Supply E-Mail/Fax/Teleconference Team space/NetMeetings Project/Portfolio Management Interactive Viewing And Design Workflow And Business Process Management Data Capture/Forms Product Data And Document Management Analytics/Integration/Security
Product Launch Dashboards Differ Based On User Role Role Enterprise Performance Management ROA Intellectual Plant Inventory Market Success Growth- On-time- Reliability ROI R&D-Production- Marketing CXO Define Develop Promote Supply Support Product Portfolio Management Program Management Office Ideation Portfolio Optimization Financials Roadmap Phase-gates Risk Project/Program Management Program Manager Work-Breakdown Structure Skill-sets Role-tasks Resource allocation Schedule Team Readiness Product Development Execution Cross-functional Team Visualization Requirements Change notification Platform-systems Capability Team Execution Foundation Integration Content management Data capture Analytics Security Search-retrieve Best-practices Collaboration Source: AMR Research, 2007
Innovation DashboardsWhere is the benefit? • Cell phones – 2X increase in products launched TTM reduced 50% • Food products – 25% value increase on 40% fewer projects • Specialty materials – 40% increase new product revenue • Specialty Chem – 20-30% margin imprv. and 15% pipeline productivity • Tier 1 Auto – 400% increase in customer quotes • Process Benefits (risk reduction) • Med. Device – Monitor metrics to determine cause and effect in NPD • A&D – Manage globally distributed Integrated Product Teams • Tier 1 Auto – APQP process for supplier qualification on NPD
Stages Of Maturity For New Product Launch Growth and Profitability Cost to Serve Cost to Deliver Demand Driven Value Driven External supply partners become integral to product innovation and launch and demand analytics evaluate opportunity trade-offs Joint value creation by orchestrating the innovation process across an extended value chain and architecting products and services that combine partner expertise Externally Focused III IV II I Customer / Brand Driven Efficiency Markets Focused Internal integrated product teams share a common set of product information and standardized new product introduction & launch practices Internally Focused Product development operates in a silo and pushes innovation out in search of a market to serve Cost Focused Revenue Focused Source: AMR Research, 2007
Case Examples • Stage II – Customer/Brand Efficiency • General Motors – 35% reduction in its global development budget by consolidating over 1500 systems • Procter & Gamble – millions saved using a global specifications d-base to rationalize items • Stage III – Demand Driven • Lockheed Martin F35 JSF – military served by common design platform. Program coordinated across suppliers • Kraft’s Star Network - design network for early stage innovation. 98% of R&D resources from external sources. • Stage IV – Value Driven • Boeing’s 787 – design driven by airline efficiency needs. 80% external partner innovations for composites and controls • Kimberly Clark – ethnographic studies understand customer behavior. Streamlined the process to reduce TTM by 50%
Takeaways And Next Steps • Innovation is an executive concern • Identify reasons for new product launch failure • Observe customers to truly understand needs • Innovation combines iterative learning and phased execution • Support open innovation for joint value creation • Use dashboards and metrics to drive value • Collaboration must support all lifecycle phases
thank you! Michael Burkett, VP Research AMR Research mburkett@amrresearch.com
© 2007 Microsoft Corporation. All rights reserved. Microsoft, Windows, Windows Vista and other product names are or may be registered trademarks and/or trademarks in the U.S. and/or other countries. The information herein is for informational purposes only and represents the current view of Microsoft Corporation as of the date of this presentation. Because Microsoft must respond to changing market conditions, it should not be interpreted to be a commitment on the part of Microsoft, and Microsoft cannot guarantee the accuracy of any information provided after the date of this presentation. MICROSOFT MAKES NO WARRANTIES, EXPRESS, IMPLIED OR STATUTORY, AS TO THE INFORMATION IN THIS PRESENTATION.