Download
1 / 9
90 likes | 96 Views
Topological Density Variations Over Time. A Comparison Between HTTP and Kazaa Peer to Peer Traffic Chris Rapier – Pittsburgh Supercomputing Center rapier@psc.edu. Data Collection. Taking 60s traces using CoralReef every 5 min for the past 6-10 months

E N D
Topological Density Variations Over Time A Comparison Between HTTP and Kazaa Peer to Peer Traffic Chris Rapier – Pittsburgh Supercomputing Center rapier@psc.edu
Data Collection • Taking 60s traces using CoralReef every 5 min for the past 6-10 months • Collected on both inbound and outbound ports of OC3 on 2 different routers • Data used here is roughly 6 weeks of outbound traffic; Oct 13 – Nov 25.
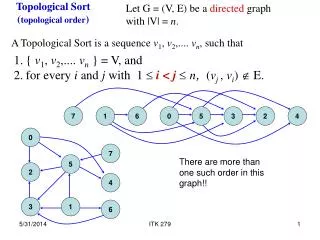
Topological Density • Traffic is matched to BPG path • Each BGP hop is considered a shell • P(t) is percentage of traffic in shell i • P(n) is percentage of ASes in shell i • V is the volume of shell i • Still working on fully validating this concept HOWEVER…
What Does It All Mean? • P2P, as expected, is incredibly volatile in terms of topology even when the traffic is relatively stable • Will this have an effect on which P2P model can be used for which application? • Can this be used to enhance the functionality of P2P?