Download
1 / 28
280 likes | 299 Views
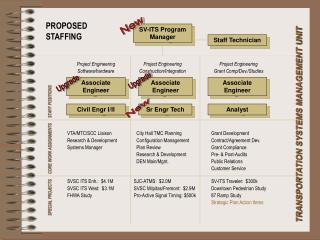
2005 CA-NV-AWWA ANNUAL FALL CONFERENCE OCTOBER 13 & 14, 2005 Tracer Studies Step-Wise Process for Planning a Study. Presented by: Guy Schott, P.E. Associate Sanitary Engineer CA DHS-Drinking Water Program 707-576-2732 gschott@dhs.ca.gov. What to Expect from This Presentation.

E N D
2005 CA-NV-AWWA ANNUAL FALL CONFERENCEOCTOBER 13 & 14, 2005Tracer Studies Step-Wise Process for Planning a Study Presented by: Guy Schott, P.E. Associate Sanitary Engineer CA DHS-Drinking Water Program 707-576-2732 gschott@dhs.ca.gov
What to Expect from This Presentation • Information to help plan and conduct a successful tracer test.
Why Conduct a Tracer Study? • Required by Regulatory Agency to determine t10 or modal contact time for inactivation credit. • To prove higher hydraulic efficiency than what was assigned by the Regulatory Agency. • To evaluate the hydraulic efficiency of a reactor for possible improvements.
Definitions • t10 – is defined as the amount of time it takes for 10% of a non-reactive material to pass through a basin (Drinking Water). • T: Theoretical Detention • t10/T: Short-Circuiting Factor • Modal Contact Time – is the amount of time for peak tracer concentration to be observed in the effluent from the basin (Slug-Dose Method, Recycled Water).
Common Basins that are Evaluated • Clearwell (baffled or non-baffled) • Sedimentation Basin • Ozone Contactor • Open Channel (Recycled Water)
Type of Tracer Tests • Step-Dose Method – a continuous tracer feed added throughout test. • Slug-Dose or Pulse-Input Method – adding the entire amount tracer at the beginning of test (the time it takes to add tracer must be no more than 1 to 2% of the theoretical detention time.)
Select Tracer Test Can tracer be slug-dose within 1-2% of theoretical contact time? Step Dose No Yes No Step Dose Can outlet flow be determined throughout test? Yes Slug or Step-Dose Method
Select Tracer Most common tracers: • Fluoride (prefer acid form, H2SiF6) • Lithium as LiCl (dry) Others • NaCl • Rhodamine WT • Calcium • Zinc
Select Tracer Tracer must be: • Conserved (no decay, complexing or removal) • Do not use fluoride in sedimentation basins, use lithium or other salt. • Acceptable for potable use (in drinking water) • Easily monitored (minimal background interference). • Suitable for tracer addition method.
Analytical Cost - Fluoride • Fluoride (in-house analysis) • Hach sensION2 Instrument ($535) • Fluoride Probe ($295) • Or Fluoride Probe plus buffers, standards, etc. ($410) • Can perform from 20 to 25 samples per hour • Total In-House Cost (~$950) excluding about 4 hours of labor to analyze 80 samples • Fluoride (samples sent to laboratory) • Laboratory Cost $10 to $30 per sample or $800 to $2,400 for 80 samples
Analytical Cost - Lithium • Lithium • requires very little tracer mass in tracer test. • Analytical methods: atomic absorption (AA) spectrometry or inductively coupled plasma (ICP) • Laboratory Cost: ~ $15 - $30 per sample • For 80 samples, cost range from $1,200 to $2,400.
Tracer Concentration • Step or Pulse Input Dose – • Fluoride • The higher the level, better response time for ion-selective analysis • Get permission from regulatory agency to go up to 4.0 mg/L. • If outlet flow of reaction basin is followed by another basin (dilution), then increase tracer concentration. • Lithium • In California, approved up to 0.5 mg/L peak. Up to 2 mg/L with justification.
How Much Tracer to Add in a Slug-Dose Test – “Tricky” Theoretical based on CSTR Modeling
Length: total distance water can travel divided by the channel width (L:W).
How Many Test and at What Flow? • Depends on the requirements of your regulatory agency. • Normally have 1 to 3 tests at different flows. • If only one test, then recommend at normal operational flow (during summer usages). • If run 3 tests, then low, medium and high flows.
Test Run Length • Ideally, 3 to 4 theoretical detention times (T) (for validation of results). • Less may be adequate if situation calls for it (i.e., extremely long run time). • Extrapolate results to predict full recovery in Slug Dose test.
Number of Samples • Must have adequate number of samples to define mass recovery curve. • Recommend 70 – 80 samples per test for the Step Input method. • Recommend 80 – 90 samples per test for the Pulse Input method. • For very short runs (T < 30 minutes), less samples are appropriate
Sample Frequency Most important area, increase sample frequency
Sample Frequency Important area. Most important area, increase sample frequency
Know Your Testing Instrument If tracer analysis is done in-house, then • Know your instrument and understand the analytical procedures. • Practice with your instrument and be sure it is working properly before actual tracer test.
Flow Meter – Is it accurate? • If flow meter is not accurate, then the t10 value will be off and mass recovery in the slug dose test will be off. • If unsure on flow meter accuracy, then request to have it calibrated.
Does Outlet Flow and Tank Level Needs to be at Steady-State Throughout Test? • Step-Dose Method • Exit flow and tank level may vary after the t10 has been established. • Inlet flow must remain at steady-state throughout test to achieve steady-state tracer concentration at outlet. • Slug-Dose Method • Inlet and exit flows and tank level may vary after the t10 has been established. • Must be able to accurately measure exit flow throughout test.
Goal: high mass recovery (90 – 100 %) 80% - 90% (fair to good recovery) If mass recovery is less than 80 or greater than 110%, then investigate what went wrong. Review analytical method Check your math on the amount of tracer added Check accuracy of flow meter Verify chemical feed pump dosage in Step-Dose Method Were samples taken at inlet basin to verify dosage? Tracer Mass Recovery
Develop Tracer Protocol • A well developed test protocol can result in a successful test. • Submit to Regulatory Agency for review and comments.
Reference • Tracer Studies in Water Treatment Facilities: A Protocol and Case Studies American Water Works Association Research Foundation ISBN 0-89867-857-9
Tracer Study Data Base To receive copy of California’s tracer data base, send email to: Guy Schott gschott@dhs.ca.gov Summarizes results of tracer test and respective tank configurations.