Download
1 / 8
80 likes | 89 Views
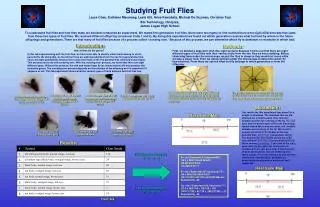
Will use Fruit Flies for our example. R = Red eyes Rr X Rr r = White eyes. The Chi-Square Test. Used to confirm whether a set of data follows a specific probability distribution. IE…how likely is it that deviations from expected results are due solely to chance?.

E N D
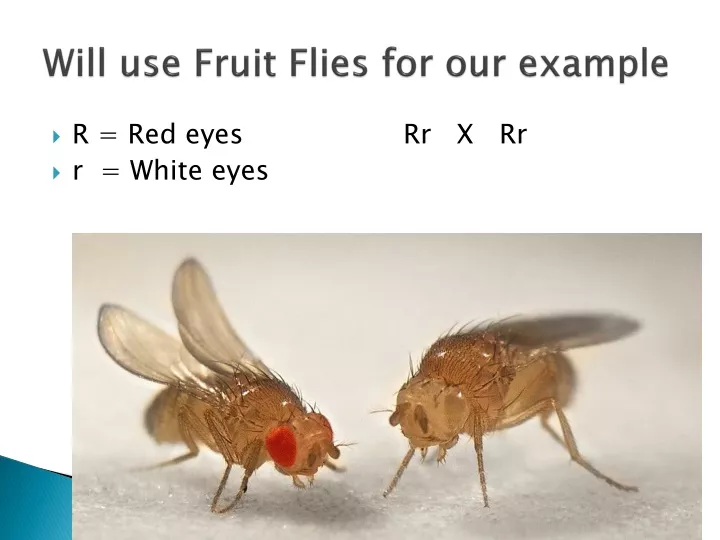
Will use Fruit Flies for our example • R = Red eyes Rr X Rr • r = White eyes
The Chi-Square Test Used to confirm whether a set of data follows a specific probability distribution. IE…how likely is it that deviations from expected results are due solely to chance?
Goodness-of-fit test • Uses a sample to test whether a frequency distribution fits the predicted distribution • Example: Used to answer the following ques • Can we conclude that the 3:1 ratio is true based on the observation of _____(#) of fruit flies.
Observed vs. Expected Frequencies • The chi-square test basically compares the observed (O) and the expected (E) frequencies to determine whether there is a statistically significant difference • Observed frequency is the # of flies seen for each phenotype • Expected frequency is the # of flies expected for each penotype • Example: if cross is a monohybrid one, you would expect a 3:1 phenotypic ratio. Therefore, if you observed 100 flies, 75 of them should have the dominant phenotype, while 25 of them should have the recessive phenotype
Chi-square statistic • Use the following equation:
Determining the Critical Chi-Square Score • Use an already constructed table to see where your Chi-square value falls. • Which row you look in depends on the number of degrees of freedom. • The number of degrees of freedom is equal to the number of phenotypic categories minus 1. • Monohybrid… • Dihybrid… • Sex-linked…
Chi-square Values and Probabilities • 2 ways to analyze • if X2 is less than number in box, good fit… • If P value is greater than .05, than good fit Means your data did not happen by chance.
Let’s do an example problem • A cross between two fruit flies that are heterozygous for red eyes produced the following offspring: • 260 Red eyes • 178 White eyes • Calculate X2 for this experiment