Download
1 / 11
110 likes | 122 Views
CONFERENCE EVALUATION DATA ANALYSIS. DATA ANALYSIS. A credible amount of data has to be collected to allow for a substantial analysis Information collected must now be described, analyzed and interpreted

E N D
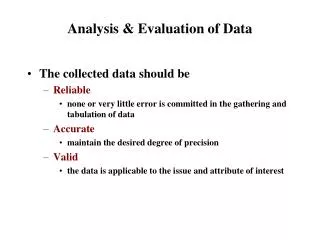
DATA ANALYSIS • A credible amount of data has to be collected to allow for a substantial analysis • Information collected must now be described, analyzed and interpreted • You have to look beyond the raw data to ask important questions about what the results mean and whether they are significant • You have to check the data to ensure that it is “clean” and look for inconsistencies
DATA ANALYSIS – process used Group data according to evaluation questions /report sections Analyse data using appropriate analyticalstrategies Writetexts and create graphs for each report section
DATA ANALYSIS Quantitative and qualitative methods produce different types of data • Quantitative data produces numerical values • Qualitative data produces narratives But for both quantitative and qualitative data, the same analytical strategies are used for data interpretation
DATA ANALYSIS Basic analytical strategies: Describing Factoring Clustering Comparing Finding commonalities Finding covariation Ruling out rival explanations Counting Factoring Modeling Examining deviant cases Telling a story • source: “Evaluation”, by Susan Weiss, (1998)
DATA ANALYSIS • Often comparing, clustering and finding commonalities are used in conference evaluation • What is more useful for the conference organiser? • “85% of participants rated positively the conference” • “85% of participants rated positively the conference compared to 92% from the previous year” • “Scientists rated the conference 10% lower than other groups attending”
SURVEY DATA ANALYSIS – Descriptive Comparison Proportions Ranking/priorities
SURVEY DATA ANALYSIS – Descriptive Trends / changes Covariations
SURVEY DATA ANALYSIS – Commonalities Interested to see who said “No”! Graph shows from which categories are the “No”
DATA ANALYSIS – Qualitative data Steps for evaluating qualitative data • 1. Read through the responses. • 2. Create response categories. • 3. Label each comment with one or several categories. • 4. Look at what you have. • 5. Think what are the responses about? • 6. Identifying the patterns and trends.Try and avoid turning qualitative data into quantitative data!
DATA ANALYSIS TO REPORTING • As you analyse your data, you are arriving at your own assessment of what your findings mean -key questions to ask: • Patterns and themes are emerging – do you have enough evidence to justify your conclusions? • Have you ruled out other explanations and examined exceptions to the patterns you are seeing? • Do you need to run correlation analysis (SPSS) to test if the differences observed are statistically significant? • Do you need to have a colleague double-check your findings against your data? • You should then be ready to move to writing your report