Download
1 / 9
280 likes | 3.06k Views
ECG Changes in Acute Myocardial Infarction. Myocardial Ischemia Symmetrical T wave inversion or elevation and ST segment elevation or depression Myocardial Injury ST segment elevation or depression Myocardial Necrosis Abnormal Q waves. Abnormal T Wave.

E N D
ECG Changes in Acute Myocardial Infarction • Myocardial Ischemia • Symmetrical T wave inversion or elevation and ST segment elevation or depression • Myocardial Injury • ST segment elevation or depression • Myocardial Necrosis • Abnormal Q waves
Abnormal T Wave • Repolarization begins at the epicardium and progresses toward the endocardium producing a + T-wave. • Abnormal T waves indicate myocardial ischemia and appear within seconds of the onset of an acute MI. These are caused by a delay or change in direction of repolarization. • Abnormal T waves are associated with depression or elevation of the ST segment.
Abnormal ST Segments • Abnormal ST segments are present in myocardial infarction, indicating myocardial ischemia and injury, and in noninfarction-related myocardial ischemia from any cause • ST Segment Elevation • ST Segment Depression
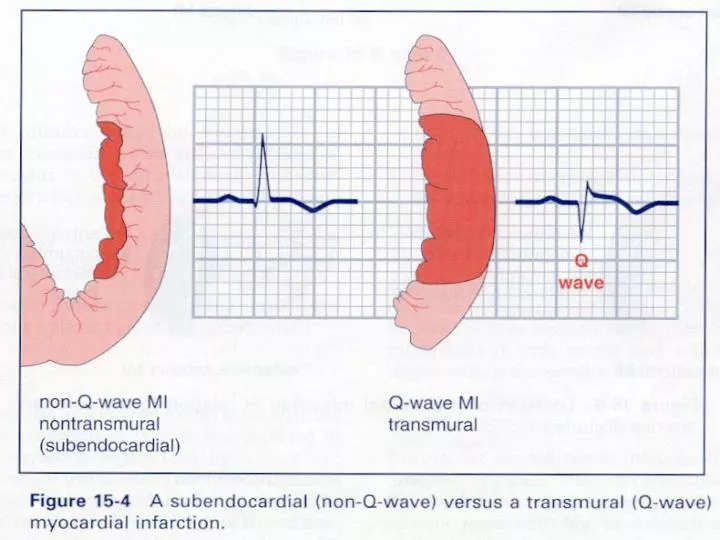
ST Segment Elevation • ST elevation is an ECG sign of severe, extensive, usually transmural, myocardial ischemia and injury in the evolution of an acute Q-wave MI. • ST elevation is considered > 1 mm above baseline and measure .04 second after the J point. • ST elevation usually appears within minutes after the onset of infarction, initially indicating extensive myocardial ischemia and a progression to Myocardial injury within 20 to 40 minutes. • Then to Myocardial Necrosis in about 2 hours and the development of abnormal Q waves.