Download

1 / 23
230 likes | 354 Views
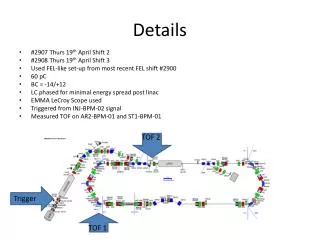
BrainStat - the details. Jonathan Taylor, Stanford Keith Worsley, McGill. What is BrainStat?. Based on FMRISTAT (Matlab) Written in Python (open source) Part of BrainPy (Poster 763 T-AM) Concentrates on statistics Analyses both magnitudes and delays (latencies)

E N D
BrainStat- the details Jonathan Taylor, Stanford Keith Worsley, McGill
What is BrainStat? • Based on FMRISTAT (Matlab) • Written in Python (open source) • Part of BrainPy (Poster 763 T-AM) • Concentrates on statistics • Analyses both magnitudes and delays (latencies) • P-values for peaks and clusters uses latest random field theory
Details • Input data is motion corrected and preferably slice timing corrected • Output is complete hierarchical mixed effects ReML analysis (local AR(p) errors at first stage) • Spatial regularization of (co)variance ratios chosen to target 100 df (Poster 610 M-PM) • P-values for peaks and clusters are best of • Bonferroni • random field theory • discrete local maxima (Poster 539 T-AM)
Methods • Slice timing and motion correction by FSL • AR(1) errors on each run • For each subject, 2 runs combined using fixed effects analysis • Spatial registration to 152 MNI by FSL • Subjects combined using mixed effects analysis • Repeated for all contrasts of both magnitudes and delays
Results (only part of slice z=-8mm is shown) Magnitude (%BOLD) Delay shift (secs) Events Blocks Events Blocks Average Diff – same sentence Diff – same speaker Interaction
Conclusions • Strong overall %BOLD increase of 3±0.5% • Substantial subject variability (sd ratio ~8) • Evidence for greater %BOLD response for different sentences (0.5±0.1%) • Evidence for greater latency for different sentences (0.16±0.04 secs) • Event design is better for delays • Block design is better for overall magnitude
Efficiency of designs • (lower is better) • for a single run, assuming • additivity of responses • For average magnitude, block is much better. • For all other contrasts in the delays, event is much better.
Magnitude (%BOLD), stimulus average Subject id, event experiment Mixed 0 1 3 4 6 7 8 9 10 11 12 13 14 15 effects 6 4 Ef 2 0 Random /fixed -2 effects sd smoothed Contour is: average anatomy > 2000 10.836mm 2 1.5 1.5 Sd 1 1 0.5 0 0.5 df 200 200 200 200 200 100 200 200 200 200 200 200 200 200 100 FWHM (mm) 20 20 50 5 15 15 100 x (mm) T 10 10 150 0 5 5 200 250 -5 0 0 120 140 160 180 P=0.05 threshold for peaks is +/- 5.1687 y (mm)
Magnitude (%BOLD), diff - same sentence Subject id, event experiment Mixed 0 1 3 4 6 7 8 9 10 11 12 13 14 15 effects 2 1 Ef 0 -1 Random /fixed -2 effects sd smoothed Contour is: average anatomy > 2000 11.4879mm 2 1.5 1.5 Sd 1 1 0.5 0 0.5 df 280 281 279 275 269 134 280 283 276 282 256 267 273 286 100 FWHM (mm) 5 20 20 -50 15 15 x (mm) T 0 0 10 10 5 5 50 -5 0 0 -60 -40 -20 0 P=0.05 threshold for peaks is +/- 5.1485 y (mm)
Magnitude (%BOLD), diff - same speaker Subject id, event experiment Mixed 0 1 3 4 6 7 8 9 10 11 12 13 14 15 effects 2 1 Ef 0 -1 Random /fixed -2 effects sd smoothed Contour is: average anatomy > 2000 11.7848mm 2 1.5 1.5 Sd 1 1 0.5 0 0.5 df 273 271 276 281 274 136 265 293 264 268 265 264 296 270 100 FWHM (mm) 5 20 20 -50 15 15 x (mm) T 0 0 10 10 5 5 50 -5 0 0 -60 -40 -20 0 P=0.05 threshold for peaks is +/- 5.1469 y (mm)
Magnitude (%BOLD), interaction Subject id, event experiment Mixed 0 1 3 4 6 7 8 9 10 11 12 13 14 15 effects 2 1 Ef 0 -1 Random /fixed -2 effects sd smoothed Contour is: average anatomy > 2000 11.4737mm 2 1.5 1.5 Sd 1 1 0.5 0 0.5 df 278 278 279 280 264 126 277 287 264 272 260 277 264 264 100 FWHM (mm) 5 20 20 -50 15 15 x (mm) T 0 0 10 10 5 5 50 -5 0 0 -60 -40 -20 0 P=0.05 threshold for peaks is +/- 5.4124 y (mm)
Delay shift (secs), stimulus average Subject id, event experiment Mixed 0 1 3 4 6 7 8 9 10 11 12 13 14 15 effects 2 1 Ef 0 -1 Random /fixed -2 effects sd smoothed Contour is: magnitude, stimulus average, T statistic > 5 13.3482mm 2 1.5 1.5 Sd 1 1 0.5 0 0.5 df 200 200 200 200 200 100 200 200 200 200 200 200 200 200 100 FWHM (mm) 4 20 20 -50 2 15 15 x (mm) T 0 0 10 10 -2 5 5 50 -4 0 0 -60 -40 -20 0 P=0.05 threshold for peaks is +/- 3.8943 y (mm)
Delay shift (secs), diff - same sentence Subject id, event experiment Mixed 0 1 3 4 6 7 8 9 10 11 12 13 14 15 effects 2 1 Ef 0 -1 Random /fixed -2 effects sd smoothed Contour is: magnitude, stimulus average, T statistic > 5 16.754mm 2 1.5 1.5 Sd 1 1 0.5 0 0.5 df 280 281 279 275 269 134 280 283 276 282 256 267 273 286 100 FWHM (mm) 4 20 20 -50 2 15 15 x (mm) T 0 0 10 10 -2 5 5 50 -4 0 0 -60 -40 -20 0 P=0.05 threshold for peaks is +/- 3.8929 y (mm)
Delay shift (secs), diff - same speaker Subject id, event experiment Mixed 0 1 3 4 6 7 8 9 10 11 12 13 14 15 effects 2 1 Ef 0 -1 Random /fixed -2 effects sd smoothed Contour is: magnitude, stimulus average, T statistic > 5 16.9641mm 2 1.5 1.5 Sd 1 1 0.5 0 0.5 df 273 271 276 281 274 136 265 293 264 268 265 264 296 270 100 FWHM (mm) 4 20 20 -50 2 15 15 x (mm) T 0 0 10 10 -2 5 5 50 -4 0 0 -60 -40 -20 0 Peaks not significant at P=0.05 y (mm)
Delay shift (secs), interaction Subject id, event experiment Mixed 0 1 3 4 6 7 8 9 10 11 12 13 14 15 effects 2 1 Ef 0 -1 Random /fixed -2 effects sd smoothed Contour is: magnitude, stimulus average, T statistic > 5 16.9013mm 2 1.5 1.5 Sd 1 1 0.5 0 0.5 df 278 278 279 280 264 126 277 287 264 272 260 277 264 264 100 FWHM (mm) 4 20 20 -50 2 15 15 x (mm) T 0 0 10 10 -2 5 5 50 -4 0 0 -60 -40 -20 0 P=0.05 threshold for peaks is +/- 3.8306 y (mm)
Magnitude (%BOLD), stimulus average Subject id, block experiment Mixed 0 1 3 4 6 7 8 9 10 11 12 13 14 15 effects 4 Ef 2 Random 0 /fixed effects sd smoothed Contour is: average anatomy > 2000 6.7765mm 1 6 Sd 0.5 4 2 0 df 209 209 214 210 211 210 210 207 212 214 214 210 210 216 99 FWHM (mm) 20 20 20 -50 15 15 15 10 x (mm) T 0 10 10 5 5 5 0 50 -5 0 0 -60 -40 -20 0 P=0.05 threshold for peaks is +/- 5.9873 y (mm)
Magnitude (%BOLD), diff - same sentence Subject id, block experiment Mixed 0 1 3 4 6 7 8 9 10 11 12 13 14 15 effects 2 1 Ef 0 -1 Random /fixed -2 effects sd smoothed Contour is: average anatomy > 2000 11.5625mm 1 1.5 Sd 0.5 1 0 0.5 df 205 206 203 206 206 204 203 201 205 200 200 201 201 205 100 FWHM (mm) 5 20 20 -50 15 15 x (mm) T 0 0 10 10 5 5 50 -5 0 0 -60 -40 -20 0 P=0.05 threshold for peaks is +/- 5.1375 y (mm)
Magnitude (%BOLD), diff - same speaker Subject id, block experiment Mixed 0 1 3 4 6 7 8 9 10 11 12 13 14 15 effects 2 1 Ef 0 -1 Random /fixed -2 effects sd smoothed Contour is: average anatomy > 2000 11.9735mm 1 1.5 Sd 0.5 1 0 0.5 df 201 202 200 206 201 201 200 200 204 204 206 201 205 204 100 FWHM (mm) 5 20 20 -50 15 15 x (mm) T 0 0 10 10 5 5 50 -5 0 0 -60 -40 -20 0 P=0.05 threshold for peaks is +/- 5.1666 y (mm)
Magnitude (%BOLD), interaction Subject id, block experiment Mixed 0 1 3 4 6 7 8 9 10 11 12 13 14 15 effects 2 1 Ef 0 -1 Random /fixed -2 effects sd smoothed Contour is: average anatomy > 2000 12.1993mm 1 1.5 Sd 0.5 1 0 0.5 df 204 200 207 200 204 205 202 203 202 204 206 201 201 200 100 FWHM (mm) 5 20 20 -50 15 15 x (mm) T 0 0 10 10 5 5 50 -5 0 0 -60 -40 -20 0 P=0.05 threshold for peaks is +/- 5.1467 y (mm)
Delay shift (secs), stimulus average Subject id, block experiment Mixed 0 1 3 4 6 7 8 9 10 11 12 13 14 15 effects 2 1 Ef 0 -1 Random /fixed -2 effects sd smoothed Contour is: magnitude, stimulus average, T statistic > 5 13.5901mm 2 1.5 1.5 Sd 1 1 0.5 0 0.5 df 209 209 214 210 211 210 210 207 212 214 214 210 210 216 100 FWHM (mm) 4 20 20 -50 2 15 15 x (mm) T 0 0 10 10 -2 5 5 50 -4 0 0 -60 -40 -20 0 P=0.05 threshold for peaks is +/- 3.983 y (mm)
Delay shift (secs), diff - same sentence Subject id, block experiment Mixed 0 1 3 4 6 7 8 9 10 11 12 13 14 15 effects 2 1 Ef 0 -1 Random /fixed -2 effects sd smoothed Contour is: magnitude, stimulus average, T statistic > 5 14.3802mm 2 1.5 1.5 Sd 1 1 0.5 0 0.5 df 205 206 203 206 206 204 203 201 205 200 200 201 201 205 100 FWHM (mm) 4 20 20 -50 2 15 15 x (mm) T 0 0 10 10 -2 5 5 50 -4 0 0 -60 -40 -20 0 P=0.05 threshold for peaks is +/- 4.0888 y (mm)
Delay shift (secs), diff - same speaker Subject id, block experiment Mixed 0 1 3 4 6 7 8 9 10 11 12 13 14 15 effects 2 1 Ef 0 -1 Random /fixed -2 effects sd smoothed Contour is: magnitude, stimulus average, T statistic > 5 14.3951mm 2 1.5 1.5 Sd 1 1 0.5 0 0.5 df 201 202 200 206 201 201 200 200 204 204 206 201 205 204 100 FWHM (mm) 4 20 20 -50 2 15 15 x (mm) T 0 0 10 10 -2 5 5 50 -4 0 0 -60 -40 -20 0 Peaks not significant at P=0.05 y (mm)
Delay shift (secs), interaction Subject id, block experiment Mixed 0 1 3 4 6 7 8 9 10 11 12 13 14 15 effects 2 1 Ef 0 -1 Random /fixed -2 effects sd smoothed Contour is: magnitude, stimulus average, T statistic > 5 14.4178mm 2 1.5 1.5 Sd 1 1 0.5 0 0.5 df 204 200 207 200 204 205 202 203 202 204 206 201 201 200 100 FWHM (mm) 4 20 20 -50 2 15 15 x (mm) T 0 0 10 10 -2 5 5 50 -4 0 0 -60 -40 -20 0 Peaks not significant at P=0.05 y (mm)