Download
1 / 12
130 likes | 269 Views
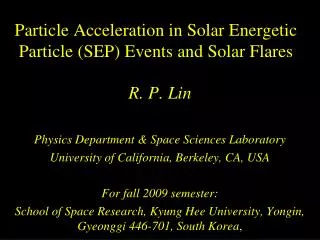
Energetic solar particle dynamics during 28 October, 2003 GLE. E.V.Vashenyuk a , Yu.V. Balabin a , B.B. Gvozdevsky a , L.I. Miroshnichenko b , K.-L. Klein c , G. Trottet c , and P. Lantos c. (a) Polar Geophysical Institute, Apatity, Murmansk region 184 209, Russia

E N D
Energetic solar particle dynamics during 28 October, 2003 GLE E.V.Vashenyuka, Yu.V. Balabina, B.B. Gvozdevskya, L.I. Miroshnichenkob, K.-L. Kleinc, G. Trottetc, and P. Lantosc (a) Polar Geophysical Institute, Apatity, Murmansk region 184 209, Russia (b) IZMIRAN, Troitsk, Moscow region, 142 190, Russia (c) Observatoire de Paris, LESIA, CNRS-UMR 8609, 92195 Meudon, France
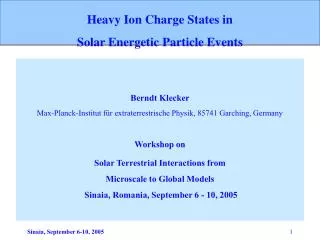
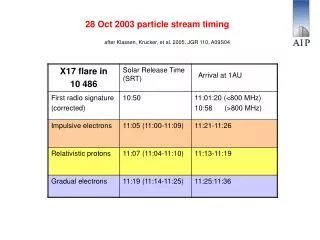
Fig.1. The GLE of 28 October 2003 by the worldwide neutron monitors network data d a b Fig. 1. (d) Asymptotic cones (AC) of acceptance in GSE coordinates for the NM stations at figures a-c. Solid parts of lines denote the portions of maximal response of AC. The equal pitch angle lines are depicted relative to the derived axis of symmetry direction at 12.00 UT. By and◉symbolsare marked the IMF directions (data of ACE spacecraft) from 11 to 12 UT of 28 October 2003. ( ) is derived direction of maximal intensity during the impulse-like increase at 11.25 UT. c Fig. 1. (a-c) increase profiles at a number of NM stations: AP-Apatity, Ba-Barentsburg, McM-McMurdo, No-Norilsk, CS-Cape Schmidt, TA-Terre Adelie, Mo-Moscow. Vertical arrow marks a moment of main radio onset (11:02 UT). Note the prompt initial impulse-like increase seen by Norilsk, Cape Schmidt and Moscow stations.
Fig.2. Dynamics of relativistic solar protons CS (а) increase profiles at neutron monitor stations Norilsk (solid line) and Cape Schmidt (dashed line). Numbered arrows are the moments of time (Table 1), when parameters of RSP were derived. No Dynamics of derived pitch angle distribution: (b) during the initial impulsive increase; (c) during the main intensity maximum. Dynamics of derived energy spectra: (d) in double logarithmic, (e) in semi-logarithmic scale. Data of direct solar protons are crosses (balloons) and blacked squares (GOES-10/11 spacecrafts).
ABSTRACT • A ground level solar particle event (SPE) on October 28, 2003 related with a not well-connected flare 4B/X17.2, S16 E08 possessed of a number of unusual features. From the neutron monitor data by the modeling technique parameters of relativistic solar protons (RSP) were obtained and their dynamics studied in course of GLE. Among RSP two populations clearly could differ: prompt and delayed ones. The prompt solar protons caused an impulselike increase at a few neutron monitor stations looking perpendicular to the mean IMF direction. The delayed solar protons had slow intensity rise and arrived at Earth from the antisunward direction (looking along IMF). It is argued that high-energy solar protons came to Earth along the loopelike IMF field line connecting the Earth with the eastern flare on the Sun. Such IMF structure seems to be formed by a CME of preceding flare 3B/X 1.2 on October 26, 06.17 UT. A cause of unusual anisotropy of prompt component RSP could be deviation of collimated RSP beam on a sharp kink of the IMF lines existed on the way of beam just before the Earth. • Introduction • The SPE of 28 October 2003 was related to a solar flare 4B/X17.2 that occurred in the active region NOAA 10486 slightly east of the central meridian (S16, E08) nominally not well-connected with Earth.The SPE 28.10.2003 occurred on a disturbed interplanetary background caused by interplanetary CME (ICME), (SSC was registered at 01.31 UT) from a solar flare: 3B/X1.2 , S15 E44on 26.10, 06.17 UT, and a corotating high-speed solar wind stream from a coronal hole commenced to Earth about 8 UT, three hours before the GLE onset. This paper outlines some aspects of the author’s analysis of the event [1]. The energetic spectra, and also directional characteristics of relativistic solar protons derived from the data of neutron monitors by the modeling technique can reveal possible sources of the accelerated particles on the Sun and their propagation to the Earth.
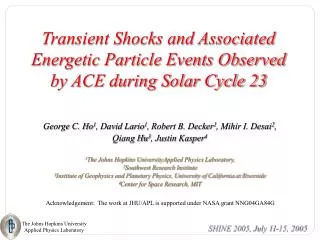
Fig.3. Plot of proton and electron arrival time versus reciprocal particle speed in units of speed of light. The lines correspond to best fits of traveled interplanetary paths for two groups of particles: 1.1 AU for subrelativistic electrons and 2.2 AU for high energy solar protons and relativistic electrons. As the release time the onset of the most conspicuous electromagnetic emissions from the corona 10:54 UT has been chosen [1].
Fig. 4.A plot of solar wind and interplanetary magnetic field parameters for October 28, 2003 (top to bottom) the proton density , the bulk velocity, the temperature, the magnetic field strength, the elevation (θ) and azimuth (Φ) of the magnetic field direction in solar ecliptic coordinates, cosmic ray intensity variations: neutron monitors Apatity (Ap) and Larc (Lrc). Vertical lines show the times: of a shock, border between ejecta and corotating stream (CS) of a fast solar wind, and GLE onset. The darkened area is a low temperature and cosmic ray depression region, indicative of ejecta (Cane, 2000, Space Sci. Rev. 93, 55-77)
2. Neutron monitors observations Fig.1, a-c panels shows increase profiles at a number of NM stations. The vertical arrow marks the main radio onset (11:02 UT), the suggested moment of particle acceleration [1]. The character feature here is the impulselike increase at Norilsk station (prompt component of RSP) contrasted with a gradual increase at Mc Murdo (delayed RSP component). In Fig.1 c thecalculated asymptotic cones (AC) for the NM stations (Fig.1a-c) are shown. The equal pitch angle lines are depicted relative to the derived (by modeling technique, section 3) axis of symmetry at 12.00 UT. The IMF direction (ACE spacecraft data) are shown and it is strongly deviated from the mean Parker spiral. It is notable that McMurdo and Terre Adelie stations registered the maximum increase, had their asymptotic cones (AC) turned not far from the IMF direction. And the AC of Norilsk station registered the prompt impulselike increase was looking nearly perpendicularly in respect to IMF. By asterisk in Fig.1d is shown the derived symmetry axis (section 3) of the beamlike short lived flux of the prompt component RSP. 3. Modeling of NM responses With the modelingof the NM responses to an anisotropic solar proton flux and comparing those with observations the parameters of primary solar protons can be derived by a least square technique [2-4]. So the parameters ofmodified power rigidity spectrum with variable slopeJ||(R) = J0R-*, * = + ·(R-1) where is a power-law spectral exponent atR = 1 GV, is a rate of increase per 1 GV. The other parameters are: coordinates and , defining anisotropy axis direction in the GSE system; and a parameter C, characterizing the pitch-angle distribution in form of a Gaussian: F(θ(R)) ~ exp(-θ2/C). So, 6 parameters are to be determined: J0, , , C, , [3, 4]. For the very complicated event of 28.10.2003 we had to use a model with two completely independent particle fluxes, accordingly, the number of parameters in this model grows up to 12. In Table 1 the parameters ofthese two fluxes are presented for 6 moments of time. So the dynamics of RSP in course of the GLE can be traced (Fig.2).
Fig. 5. (a). Sketch of the proposed model for the IMF structure during the 28 October, 2003 SPE. The earth is at a boundary area between an ejecta from the flare 26 October and the corotating stream (CS) commenced to Earth shortly before the event. By means of looped IMF structure inside ejecta the Earth is connected to a flare site in easternpart of solar disc. High energy solar protons (HEP) come to the Earth from antisunward direction. At the same time, the subrelativistic electrons can arrive to the Earth from a source in western part of solar disk along of a Parker spiral IMF line, connected with a corotating stream. (b). The spatial structure of IMF near the Earth during the 28 Oct 2003 GLE, reconstructed with use of IMF and solar wind data. The dotted lines are the IMF field lines and arrows are average directions of relativistic proton flux registered by neutron monitors in Mc- Murdo (McM) and Norilsk (No). By essential detail here is the sharp kink of a magnetic field with the radius of curvature 3·106 km comparable with Larmor radii of relativistic solar protons.
Fig.6. Model of IMF curvature and particle transportthrough the field line kink during the 28.10.2003 GLE. The simulated particle trajectories are shown. Particles with large pitch angles are scattered a little on the kink and pass through it keeping the direction of movement along the magnetic field. The particles with small or zero pitch angle are strongly deviated at the IMF kink. θ is pitch-angle
4.Relativistic solar proton dynamics Fig. 2 b, c shows the dynamics of pitch angle distribution (PAD). Pitch angles are counted in respect to asymmetry axis of delayed component (Fig.1). The prompt component (PC) of RSP are presented by the initial pulse of intensity, instants 1-4. The PAD for the PC is rather narrow and its symmetry axis is nearly normal to both the mean IMF and the symmetry axis of delayed component (Fig. 2 b). Fig.2 c shows the PAD evolution during the main intensity increase dominated by the delayed component(instants 5-7). In this time all particles arrived approximately along the symmetry axis, but from the antisunward direction. Near the peak of the main increase (instant 7) the PAD becomes broader and additional flux appeared from the opposite direction. The derived energetic spectra within the estimated error limits for the initial peak (PC) can be approximated by an exponential in energy: J = 1.5·105exp(-E/0.4) m-2s-1st-1MeV-1. During the maximum of the main increase (instants 5-7) the spectrum becomes a power law in energy: J =3.5·103E-3.5m-2s-1st-1MeV-1. The direct solar proton fluxes obtained by GOES-11 spacecraft and balloons launched in Apatity (Joint Lebedev Physical Institute and Polar Geophysical Institute balloon experiment [5]) are in good agreement with derived spectra. 5. Estimated interplanetary path of different kinds of particles The traveled path of protons and electrons of different energies was estimated in [1] on the delay of arrival to Earth in respect to the suggested moment of particles generation on the Sun. Fig. 3 shows the plot of proton and electron arrival time versus reciprocal particle speed in units of speed of light. The lines correspond to best fits of traveled interplanetary paths for two groups of particles: 1.1 AU for subrelativistic electrons and 2.2 AU for high energy solar protons and relativistic electrons. As the release time the onset of the most conspicuous electromagnetic emissions from the corona 10:54 UT has been chosen.So the traveled path in interplanetary medium for subrelativistic electrons was close to the estimated Parker spiral length (1.04 AU) and for high-energy proton it turned out to be about twice as much longer.
2. Discussion and conclusions On the ground of neutron monitor modeling results carried out above and author’s analysis with using a great complex of data including solar radioemission, spacecraft particle and radiowave data [1] the energetic particle dynamics can be described in a scheme shown in Fig.2. Early 28 October 2003 the ICME related to the solar flare on 26 October reach the Earth. Soon after that a high-speed solar wind stream has commenced. So at the GLE onset the Earth was at a boundary area between a CME ejecta and the corotating stream (CS). By means of looped IMF structure inside ejecta the Earth was connected to a flare site in th eastern part of solar disc. And high energy solar protons (HEP) could come to the Earth along the loopelike IMF from antisunward direction. The similar idea that in the 28 October, 2003 GLE relativistic solar protons arrived at Earth from antisunward direction propagated along the IMF magnetic loop originated in the eastern AR10486 was also considered in [6]. The subrelativistic electrons, meanwhile, arrive to the Earth from a source in western part of solar disk along a Parker spiral IMF line, connected with a corotating stream [1]. The weak delayed flux of RSP along the Parker spiral direction could be explained by effects of coronal propagation. Fig.2 b shows the spatial structure of IMF near the Earth during the 28 Oct 2003 GLE reconstructed with use of IMF and solar wind data. The dotted lines are the IMF field lines and arrows are average directions of relativistic proton flux registered by neutron monitors in Mc Murdo (McM) and Norilsk (No). By essential detail here is the sharp kink of a magnetic field with the radius of curvature 3·106 km comparable with Larmor radii of relativistic solar protons. We carried out trajectory computations in the magnetic structure shown in Fig. 2 b. The RSP of the prompt component having small pitch-angles, were strongly deviated at the IMF kink. On the contrary, the particles with great pitch angles are scattered a little on the kink and pass through it keeping the direction of movement along the magnetic field. This can explain the observed effect, namely that the strongly anisotropic particle bunch of prompt solar protons that was registered by neutron monitor at Norilsk and other stations with their asymptotic cones oriented nearly perpendicular to the IMF. The delayed component particles, in the majority having large pitch-angles, scattered a little on the kink of the IMF. So the McMurdo station looking nearly along the IMF registered a delayed RSP, coming along the IMF from antisunward direction.
References[1] L.I. Miroshnichenko et al. To appear in J.Geophys.Res. (2005).[2] M.A. Shea and D.F. Smart, Space Sci. Rev., 32, 251 (1982).[3] J.L. Cramp et al., J. Geophys. Res. 102, 24237 (1997).[4] E.V. Vashenyuk et al., 28 ICRC, 6, 3401 (2003).[5] G.A. Bazilevskaya and A.K. Svirzhevskaya, Space Sci. Rev. 85, 431 (1998).[6] J.W. Bieber et al., J.Res.Lett. 32, L03802, doi: 10.129/2004GL021492 (2005).