Download
1 / 9
90 likes | 96 Views
Theorem: Let X , Y normally distributed independent stochastic variables with mean and variance respectively. Then Y-X is normally distributed with mean and variance . 2. 2. 2. 2. Corollary: If simulation experiment with model1 and model2

E N D
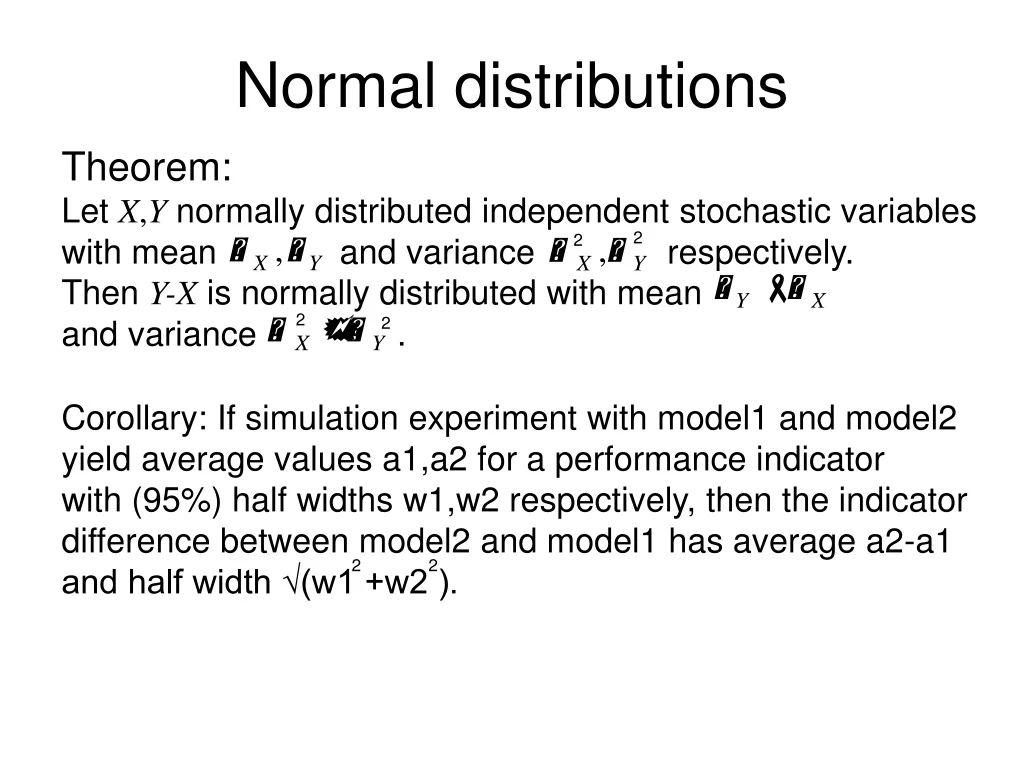
Theorem: Let X,Ynormally distributed independent stochastic variables with mean and variance respectively. Then Y-X is normally distributed with meanand variance . 2 2 2 2 Corollary: If simulation experiment with model1 and model2 yield average values a1,a2 for a performance indicator with (95%) half widths w1,w2 respectively, then the indicator difference between model2 and model1 has average a2-a1 and half width √(w1 +w2 ). 2 2 Normal distributions
Assessing improvement Problem in business process (e.g. DCT). Assess tentative solution through simulation. Hypothesis: performance indicator x after implementing the solution will be lower on average than in current situation. Indicator Average Half Width x 4.32 0.38 experiment results: current tentsol x 3.91 0.41 Test hypothesis: evaluate C T Normal distribution: simplification possible
m = 0, s =1 Improvement confidence Indicator Average Half Width x 4.32 0.38 current tentsol x 3.91 0.41 From corollary: x(ts)-x(c) has average 0.41 with 95% half width 0.56. 80% half width equals (1.28/1.96)*0.56 = 0.37. Hence with 90% confidence x(ts)-x(c)>0.04. x z(x) 0.001 3.09 0.005 2.58 0.010 2.33 0.025 1.96 0.050 1.64 0.100 1.28
Outcome of simulation experiments: Indicator Average Half Width x 4.18 0.79 T C x 3.89 0.85 Exercise What is the confidence that T>C? T-C: average: 0.29 95% hw: 1.16 ≈ 1.96*s thus, 0.29=0.49*s ≈ 69% confidence
Indicator Average wt 4.32 current tentsol wt 3.91 Taboo in reports Conclusion: The solution reduces the average waiting time compared to the current situation. Evidence: Taboo What is the standard deviation/half width? You need to assess the confidence!
Problem definition Comment on the following problem definition statements. 1. During the morning rush, long queues of cars due south appear at XXX street. A simulation study is needed to improve traffic light schedules. 2. The processing of health insurance claims of firm YYY is taking too much time, causing complaints from the health care workers. Assess by simulation some improvement proposals.
Modeling Process needing a resource and then another one. Is the model correct? Motivate your answer. If necessary, give conditions and/or an alternative model.
Process with alternative paths and resource types. Is the model correct? Motivate your answer. If necessary, give conditions and/or an alternative model.