Download
1 / 28
280 likes | 288 Views
World population, 1900-2000: poor share of total increased from 66% to 80% rich population doubled; poor almost fivefold. Iraq 5.2 23.6. Afghanistan 5.0 (1900) 27.8 (2000). Demographic transitions compared, rich vs. poor countries: annual growth rates, 1700-2000.

E N D
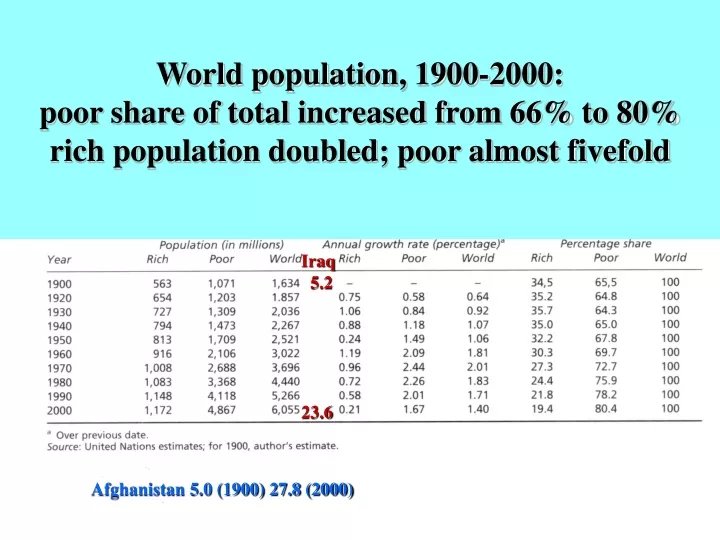
World population, 1900-2000: poor share of total increased from 66% to 80%rich population doubled; poor almost fivefold Iraq 5.223.6 Afghanistan 5.0 (1900) 27.8 (2000)
Demographic transitions compared, rich vs. poor countries: annual growth rates, 1700-2000
Relation between TFR and e025 less developed countries, 1950-55: great diversity Iraq, tfr= 7.2; e0=43 Afghanistan tfr=6.7; e0=31
Relation between TFR and e025 LARGE less developed, 1995-2000: transition well advanced Afghanistan tfr=6.0; e0=45 Iraq, tfr= 5.4; e0=58
Strong inverse correlation between sewage system and 0-4 mortality in 55 poor countries, 1980s
Per capita GDP and e0 in 25 less developed countries, 1995-2000: big increases at moderate levels of GDP
DDT eradication halved the crude death rate in malarial zones of Sri Lanka, 1930-1960
Burden of premature death and disease by world region, 1998: inequalities are large and larger yet between continents
Contraception was major factor in reducing fertility from natural levels, 31 countries
Per capita GDP and TFR, 25 less developed countries, 1995-2000—weak correlation
Literacy and TFR, 25 less developed countries, 1980s—strong correlation Afghanistan tfr=6.0; illit=70% Iraq, tfr= 5.4; illit: 30%
Fertility of married Mexican women by educational levels compared with natural fertility, 1990
The educational revolution will precipitate further declines in Mexican fertility rates (1990) None Primary Secondary Post
Decline in TFR by level of development and family planning, 1982-90: both required Test of unmet need thesis
“Wanted” TFR vs. actual TFR, by region, late 1980s-early 1990s
“Unwanted” children (%) vs. actual TFR, by region, late 1980s-early 1990sNo correlation
% current contraceptors is strongly correlated with actual TFR, in all regions (late 1980s-early 1990s)
% current contraceptors and “wanted” fertility: also strongly correlated, in all regions (late 1980s-early 1990s)
Availability of contraception is not enough:% current contraceptors is not strongly correlated with unwanted children, in all regions (late 1980s-early 1990s)
China, age structure: 1950 & 2025the effects of fertility decline
India, age structure: 1950 & 2025the effects of partial fertility decline
Increase in population and per capita GNP:27 less developed countries, 1970-92
Increase in population 1950-70 & GNP pc:27 less developed countries, 1970-92
Increase in population and per capita GNP:27 less developed countries, 1950-92
Asia: the boom in labor force growth is over: much GREATER 1965-95 than for coming 30 years, except for Muslim countries
Sub-Saharan Africa, the boom is underway: much GREATER IN COMING 30 years than for 1965-95 Increase in labor force, 1995-2025/1965-1995: Sub-Saharan Africa
Gross investment and working age population selected countries
Malawi: rapid fertility decline (from 7.6 in 1980 to 4.0) reduces schooling costs 50% by 2015—over modest fertility decline (tfr=5.5)2005, tfr= 6.5