Download
1 / 53
530 likes | 655 Views
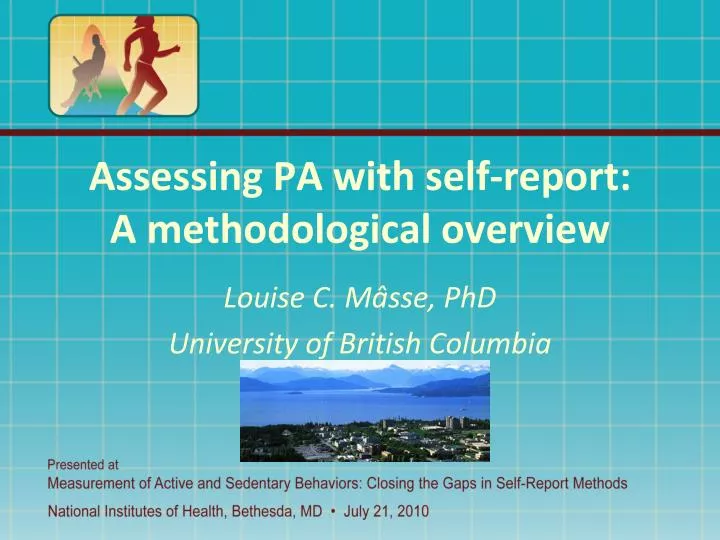
Assessing PA with self-report: A methodological overview. Louise C. M âsse, PhD University of British Columbia. Overview of talk. Utility of self-report Type of studies PA self-report are used in Type evidence needed in these studies

E N D
Assessing PA with self-report:A methodological overview Louise C. Mâsse, PhD University of British Columbia
Overview of talk • Utility of self-report • Type of studies PA self-report are used in • Type evidence needed in these studies • How we are currently assessing the validity of PA self-report • Discuss potential issues to consider in the validation process
Utility of Self-Report? • Advantages • Most practical & economical • Only feasible method in large scale studies • Best at measuring context & type of PA performed • Limitations • Utility in some context debated • Validity & reliability less than objective methods [Sallis & Saelens (2000); Shephard (2003); Westerterp (2009)]
Methodological Consideration • Validation sample • Study design • Validation criterion • Statistical procedures
Methodological Consideration • Validation sample • Study design • Validation criterion • Statistical procedures • Content validation process - completed • Qualitative interviews • Cognitive interviews • Pilot testing….
Statistical Procedures Level of evidence Association Agreement Criterion Sensitivity to change
Level of evidence & interpretation • Association • Indicate whether different people who responded to the questions did more or less PA (Ranking of the scores on the PA self-report ).
Level of evidence & interpretation • Association • Indicate whether different people who responded to the questions did more or less PA (Ranking of the scores on the PA self-report ). • Agreement • Allow the scores on the PA self-report to be interpreted in terms of actual amount of PA the person does. Actual min would correspond to the behavior.
Level of evidence & interpretation • Association • Indicate whether different people who responded to the questions did more or less PA (Ranking of the scores on the PA self-report). • Agreement • Allow the scores on the PA questionnaire to be interpreted in terms of actual amount of PA the person does. Actual min would correspond to behavior Relative interpretation Absolute interpretation
Type of studies & Level of evidence Group level validity Individual level validity
Associations – Epidemiological studies • Relationship between PA and health exist Level of PA CVD risk factors High Low Requires valid relative ranking for PA self-report Moderate Moderate Low High
Associations – Epidemiological studies Correlation, regression, intra-class correlation • Appropriate methods to assess ranking? • Limited in their ability to account for measurement errors in the validation process PA Self-Report Criterion
Associations – Epidemiological studies • Statistical models that account for both measurement errors (Buonaccorsi, 2000) and correct for attenuations in epidemiological studies are not new but deserve more attention. Mixed models Family of statistical procedures
Associations – Epidemiological studies Full sample N = 1000 Uncorrected association = .25 PA Self-report CVD risk factors
Associations – Epidemiological studies Full sample N = 1000 Uncorrected association = .25 Corrected association = .35 PA Self-report CVD risk factors Correction for Attenuation N=200 Criterion (subset of sample)
Surveillance Studies • Relative ranking – Association • If reliability is acceptable then it can be used to assess group level change from year to year • Assume no secular trend affecting patterns and that the questions remain the same Can detect group level change Cannot assess % meeting recommendation
Surveillance Studies • Absolute interpretation – Agreement • % meeting PA recommendation need actual min • Issue to consider • Do we have a valid criterion?
Possible Criterion • Accelerometers • VO2 max • Doubly Labeled water • Pedometers • 6 min walk test • Run test • Heart rate • Body fat • FEV….
Useful Criterion • Accelerometers • VO2 max • Doubly Labeled water • Pedometers • 6 min walk test • Run test • Heart rate • Body fat • FEV….
Criterion • Accelerometry • Min above a certain count can be compared • Does not capture all activities (walking based)
Criterion • Doubly Labeled water • TEE = RMR + TEF + AEE (Kcal metric) • Self-report PAEE = min * MET value * BW/60 • High intensity activities account for 25% of AEE need to assess moderate and inactivity (Westerterp, 2009)
Criterion Low Moderate High Intensity activities • Doubly Labeled water • TEE = RMR + TEF + AEE (Kcal metric) • Self-report PAEE = min * MET value * BW/60 • High intensity activities account for 25% of AEE need to assess moderate and inactivity Westerterp, 2009
Criterion • Transforming the instruments on the same metric does not mean that both instruments (self-report and criterion) are capturing the same thing. VERSUS
Agreement – Surveillance studies • Appropriate methods to assess agreement? • Other methods to quantify agreement? Bland & Altman, group comparison (t-test – Anova – MANOVA), kappa, Kendall tau-b = PA Self-report Criterion
Quantifying Agreement • Intra-class correlation • Receiver Operating Characteristic (ROC) – (application Trost et al, 2006) % meeting PA rec. Criterion Self-report
Quantifying Agreement • Intra-class correlation • Receiver Operating Characteristic (ROC) – (application Trost et al, 2006) % meeting PA rec. Criterion Self-report
Should we focus on quantifying bias (over reporting) as a way of improving agreement?
Correcting for bias – systematic error • Developing prediction equations • PA min from criterion • PA categories from criterion (Meeting / not meeting rec.) • Challenges • Modeling the type of errors we have (Plankey 1995 BMI) • Drift phenomenon - verifying that bias is consistent over time or sample (Gorber 2010 BMI) • Learning from the educational field • Measurement error models
Intervention studies • Is the measure able to detect differences pre / post interventions? • Appropriate methods to assess change? • Other methods to quantify change? Anova, t-test, Wilcoxon test = Change in PA Self-report Change Criterion
Quantifying change • Validating change scores with “correlational methods” (regression methods) • Accurately rank the change with PA self-report • Validating change scores with “agreement methods” • Change score can be meaningfully quantified (in min for example)
Item Response TheoryRasch Models • Two key assumptions are problematic • Local independence • Essential unidimensionality
Assumptions PA domains • 1-dominant dimension that explains about 40% of the variance. This assumes high correlations among domains. • Errors are not correlated after you account for dominant dimension. Household Yard work Family Volunteer Transportation Exercise / Sports Employment Miscelanneous
Assumptions PA domains Correlation likely to be moderate Household Yard Correlation likely to be low or non-existent Family Community Transportation Exercise / Sports Employment / unpaid work Miscellaneous
Assumption test – real data • Minority women (N=250) • Essential unidimensionality test • Factor analysis forcing a 1-factor solution
Assumption test – real data • Correlations among domains • Highest correlation = 0.207 • Next highest correlation = 0.137 • 1-factor explain 16% of total variance • A 2nd factor would explain 14% of total variance • Not all items load on 1st dimension Clear violation of the assumptions
Can Advanced Psychometric methods be used to Validate PA measures?
Take home message Validation evidence Epidemiological studies Association Surveillance studies Agreement Intervention studies Sensitivity to change Can we estimate the % meet who PA recommendation?