Download
1 / 82
820 likes | 935 Views
Award of 3.4 GHz and 10 GHz Licences. FWACC 13th December 2000. Steve Jones Introduction. Introduction. www.radio.gov.uk 26th January 2001. James Kinsley Overview. Today……. Overview of Programme to Date…. Scenarios modelled Summary of preliminary findings Markets/Revenue Report

E N D
Award of 3.4 GHz and10 GHz Licences FWACC 13th December 2000
Steve Jones Introduction
Introduction • www.radio.gov.uk • 26th January 2001
James Kinsley Overview
Today……. • Overview of Programme to Date…. • Scenarios modelled • Summary of preliminary findings • Markets/Revenue Report • Technical/Costs Report • Financial/Valuation Report • Economic Report • Way forward
11th December 20th September information memorandum 1 2 3 6-8 weeks 4-6 weeks Analysis Workshops 13th December Basic Programme steering group Analysis (Stage 2) Analysis (Stage 4) **Late February!** Industry group
Licence Scenarios • Look at a range of business cases 48 licence scenarios !! • Defined generic licence types • New and existing operators
Main Licence Scenarios x 6 City Regional National New Venture Existing operator
Main Licence Scenarios • City = 9 cities combined = area of 4,500 km2 • Regional = rest of the country - City = area of 240,000 km2 • National = City + Regional
Licence Scenarios • Defined generic licence types • New and existing operators • 4 cellular configurations
Licence Scenarios x 24 City Regional National A B C D A B C D A B C D New Venture A B C D A B C D A B C D Existing operator
Licence Scenarios • Defined generic licence types • New and existing operators • 4 cellular configurations • Basic and optimistic (“lucky break”) cases
Licence Scenarios x 48 City Regional National Basic Basic Basic A B C D A B C D A B C D New Venture “Lucky” “Lucky” “Lucky” Basic Basic Basic A B C D A B C D A B C D Existing operator “Lucky” “Lucky” “Lucky”
Preliminary Findings (1):Limiting factors • Size of spectrum - this dictates: • subscriber density that is supportable (i.e. market share is not really limited by competition from other access technologies or by subscriber take-up), and therefore……. • …..nature of overall usage (i.e. “infill”/complementary); • …..initial targeting of customers (“cherry-picking”, because demand is likely to exceed supply)…. • “upgradeability” - an increased hunger for bandwith from the customer base over time will effect overall viability of the business case of the spectrum on offer • number of licences per region (i.e. 1-2); • Backhaul costs - these are high, unless you use microwave
Preliminary Findings (2):Limiting Factors • Rural areas unattractive to operators • Banks cautious about lending to sector • FSA letter sent to banks following review by FSA of 34 banks’ exposure to telecoms sector. (FT 8/12/00) • “Banks are capping the amount of exposure to this sector” (FT 8/12/00) • banks expect conditions to improve in about 6 - 9 months
Preliminary Findings (3):City vs Regional vs National • Regional licences (i.e. assuming no rural roll-out) and national licences are viable…. • Regional licence is more attractive than National licence…. • City licence is not viable • high capital costs (i.e. more base stations) associated with smaller cell radius • assumption of no microwave backhaul
Preliminary Findings (4):Cellular configurations • 4 cellular configurations - allows us to model the relative impact on the main business case scenarios of different cell radii: • lower (infrastructure) costs and lower (subscriber) revenues vs • higher (infrastructure) costs and higher (subscriber) revenues [NB: A & B are more profitable than C & D]
Preliminary Findings (4):New vs Existing Operators • Business cases for new operator and existing operator are broadly comparable • new operator will have more ambitious aspirations than existing operators, thus revenues will be higher, especially in the early years • ...new operator will have a higher cost base, which goes someway to redress their advantage in terms of higher revenues
Preliminary Findings (6):Licence Configuration • This is clearly critical to the success of the award programme…. • No business case for a combined City licence • Licence configuration based on (artificial) geographical boundaries/regions is inappropriate…. • ……configuration based around a detailed knowledge of potential subscriber locations, is critical • Further discussion on configuration of licences later in this presentation….
Bérangère Mira-Smith Qualitative Market Research
Progress • Interviewed a further 10 companies • Operators Eurobell, Internet Central, Balloon-A-Gram • Manufacturers Adaptive broadband, PipingHot Networks, Tandberg TV • Banks Royal Bank of Scotland, Citibank, Deutsche Bank, and Bank of America
Industry Views:Services and target market • Services • Always-On/Fast link to the Internet • Voice telephony • Market share expectations • Large operators 10-15% • Small operators ‘00s or ‘000s of subscribers • Target markets • Primarily SMEs and SOHOs • High-end residential market
Industry Views:Location of target market • Prime location is suburban areas of cities, towns and business parks • strong competition in city centres (fibre, copper and in July 2001 ULL) • need to target densely populated areas to achieve base station “fill factor” and adequate return • No business case to roll out in rural areas
Industry Views:Operators’ strategies (1) • For large operators the spectrum will be complementary to existing portfolio • e.g ASDL; other spectrum e.g at 28GHz or 2GHz; and support overall strategy “do not put all your eggs in one basket” • Smaller operators will only have FWA
Industry Views:Operators’ strategies (2) • Rollout approach will : • Start from existing points of presence • Go where demand/population density is highest • But above all go where competition is not strong to establish footprint
Industry View:Regulatory & licensing matters (1) • Large operators want a national licence • Small operators want a regional licence (but wasteful at boundaries) • The amount of spectrum can only support one licence holder • Licence duration needs to be 15-20 years
Industry View:Regulatory & licensing matters (2) • Some licence clauses would be acceptable, e.g.: • “Use It or Lose It” • Rollout clauses with deadlines & penalties • No backhaul on band • Service clauses would make the licence unattractive
Industry Views:Auction vs Comp. Selection • Comparative selection is the preferred award mechanism • auctions might be clear cut but take money out of the industry • comparative selection has the means to ensure that the licence will be used • the banking community would not support an auction
Nicholas Blades Market Scenarios
Market & Revenue Model Objectives addressable market sizing based on three geographic areas cities : nine UK urban centres modelled as one whole regional : remaining UK suburban areas coverage assumptions consistent with cost model revenues generated telephony, Internet access & value added service take-up tailored to match max. subscriber density focus on most profitable subscribers / services
Model Outputs Series of revenue forecasts city, regional, whole UK licence Consistent assumptions with cost model Opex interconnect, other CoGS (e.g. CPE & installation) marketing, SG&A costs Subscriber forecast for input into cost model
FWA’s Position in the Market • FWA is small component of overall broadband market • limited spectrum • large number of competing service providers • over 100 service providers for DSL • cable modem available to 50% of households
Sensitivities • Spectrum usage and build assumptions • limits the services and subscribers which can be addressed • restricts market share aspirations • Rollout impact • denser networks take longer to rollout • revenues come on stream later • impact on return?
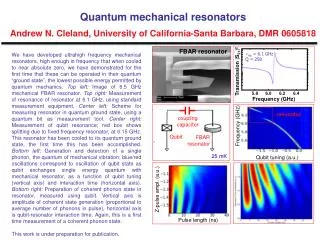
Nat - Sensitivity to Build Assumptions Half spectrum per cell - baseline cell size Full spectrum per cell - baseline cell size Half spectrum per cell - reduced cell size Full spectrum per cell - reduced cell size 0 2001 2002 2003 2004 2005 2006 2007 2008 2009 2010
Result of Spectrum Allocation • Lack of spectrum limits the maximum subscriber density achievable • spectrum driven subscriber density below the market share objectives assumed for most scenarios • operators will focus on the highest margin customers • lower likelihood of small businesses and residential customers being addressed
Abdul Ladak Infrastructure Rollout Cost Model
Stage 2 Work • Outline Planning and Dimensioning • Outline Design • Infrastructure and Rollout Costing • Radio Modelling • Further Work - Stage 4
Outline Planning and Dimensioning UK Footprint (1991 Census Data) 20,000 Sq. Km = 56% Population therefore reasonable to assume 40,000 Sq. Km = 70% Population
Capacity Planning Half Spectrum Full Spectrum F = 7 MHz (3.4 GHz) or 14 MHz (10 GHz) F = 3.5 MHz (3.4 GHz) or 7 MHz (10 GHz)
Cell Capacity Assuming: 4QAM or QPSK
“Lucky Break” • 3.4 GHz and 10 GHz Site Sharing • Low Site Acquisition Overheads • Maximised Economies of Scale • Rock Bottom Equipment Prices • Increased Microwave Backhaul • No Dark Fibre Lease • Discounted Rate for Backbone Bandwidth
Backhaul Proportions Normal Lucky Break
Radio Modelling - ITU-R 525/526/530 High Resolution (2m) 3D Data City Suburban Region 1 Suburban Region 2
Radio Coverage - City City Centre - Building Height = 100m 3.4 GHz 10 GHz

![Frequency [GHz]](https://cdn1.slideserve.com/3024092/slide1-dt.jpg)
![Frequency [GHz]](https://cdn3.slideserve.com/6756635/slide1-dt.jpg)