Download
1 / 48
480 likes | 592 Views
WANG, Wen-Chieh (Jeffrey) Chaoyang University of Technology Taichung, Taiwan. Analyzing Building Damages of a Major Earthquake Using GRASS and R. Outline. Introduction Chi-Chi Earthquake Spatial Data Analysis The Analysis Conclusion. Outline - 1. Introduction Chi-Chi Earthquake

E N D
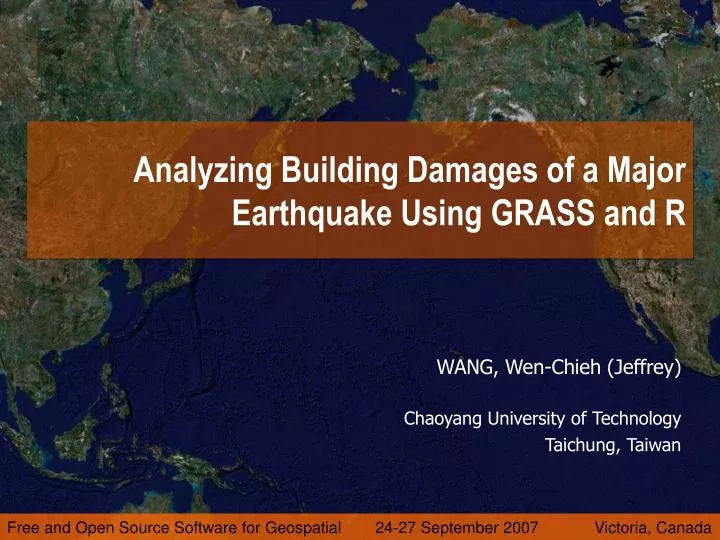
WANG, Wen-Chieh (Jeffrey) Chaoyang University of Technology Taichung, Taiwan Analyzing Building Damages of a Major Earthquake Using GRASS and R
Analyzing Building Damages of a Major Earthquake Using GRASS and R Outline Introduction Chi-Chi Earthquake Spatial Data Analysis The Analysis Conclusion
Analyzing Building Damages of a Major Earthquake Using GRASS and R Outline - 1 Introduction Chi-Chi Earthquake Spatial Data Analysis The Analysis Conclusion 1.1 Motivation 1.2 Rationale 1.3 Objectives
Analyzing Building Damages of a Major Earthquake Using GRASS and R 1.1 Motivation A magnitude 7.3 earthquake hit Taiwan on September 21, 1999. A valuable dataset recording over 7000 damaged buildings is available as an ArcView GIS 3.x shape file. Can a sensible analysis of the dataset be conducted using FOSS4G?
Analyzing Building Damages of a Major Earthquake Using GRASS and R 1.2 Rationale GRASS stands for Geographic Resources Analysis Support System. R is a free software environment for statistical computing and graphics, that provides many “packages” to handle spatial data. Both tight and loose coupling of GRASS and R in conducting spatial data analysis are popular.
Analyzing Building Damages of a Major Earthquake Using GRASS and R 1.3 Objectives Using GRASS with R as spatial data analysis tools to visualize, explore, and model the spatial aspect of building damages in the Chi-Chi earthquake.
Analyzing Building Damages of a Major Earthquake Using GRASS and R Outline - 2 Introduction Chi-Chi Earthquake Spatial Data Analysis The Analysis Conclusion 2.1 Earthquake 2.2 Non-spatial info 2.3 Spatial info
Analyzing Building Damages of a Major Earthquake Using GRASS and R 2.1 Earthquake (1) “An earthquake is caused by tectonic plates getting stuck and putting a strain on the ground. The strain becomes so great that rocks give way by breaking and sliding along fault planes.” #1 The tectonic plates of the world mapped in the second half of the 20th century. #2
Analyzing Building Damages of a Major Earthquake Using GRASS and R 2.1 Earthquake (2) Plate motion based on Global Positioning System (GPS) satellite data from NASA JPL. Vectors show direction and magnitude of motion. #2
Analyzing Building Damages of a Major Earthquake Using GRASS and R 2.1 Earthquake (3) 3 Fault types: 1. Strike-slip 2. Normal 3. Thrust #1 Preliminary determination of epicenters of 358,214 earthquakes, 1963-1998. #1
Analyzing Building Damages of a Major Earthquake Using GRASS and R 2.2 Non-spatial Info of the Earthquake #3 Chi-Chi earthquake is one of the 40 major earthquakes listed on Wikipedia. Also called the 921 earthquake. Struck Taiwan on September 21 1999. Over 2,000 people killed, destroyed or damaged over ten thousand buildings. Caused world computer prices to rise sharply.
Analyzing Building Damages of a Major Earthquake Using GRASS and R 2.3 Spatial Info of the Earthquake (1)#4, #5
Analyzing Building Damages of a Major Earthquake Using GRASS and R 2.3 Spatial Info of the Earthquake (2)#5 • Chi-Chi earthquake measured 7.3 on the Richter scale. • Its epicentre was at 23.87° N latitude, 120.75° E longitude, in Chi-Chi Township in Nantou County. • The depth was 7.0 km. #3
Analyzing Building Damages of a Major Earthquake Using GRASS and R Outline - 3 Introduction Chi-Chi Earthquake Spatial Data Analysis The Analysis Conclusion 3.1 Definition 3.2 Types of spatial data 3.3 Characteristics of spatial data 3.4 Methods
Analyzing Building Damages of a Major Earthquake Using GRASS and R 3.1 Definition Spatial data analysis focuses on the statistical description and modeling of spatial data. “Spatial data analysis is involved when data are spatially located and explicit consideration is given to the possible importance of their spatial arrangement in the analysis or in the interpretation of results.” #6 A map A process
Analyzing Building Damages of a Major Earthquake Using GRASS and R 3.2 Types of Spatial Data (1) : Point patterns
Analyzing Building Damages of a Major Earthquake Using GRASS and R 3.2 Types of Spatial Data (2) : Spatially continuous data
Analyzing Building Damages of a Major Earthquake Using GRASS and R 3.2 Types of Spatial Data (3) : Area data
Analyzing Building Damages of a Major Earthquake Using GRASS and R 3.2 Types of Spatial Data (4) : Spatial interaction data
Analyzing Building Damages of a Major Earthquake Using GRASS and R 3.3 Characteristics of Spatial Data (1) Linear regression #7 Y = β1 + β2X2 + . . . + βpXp + ε Time Series #8, #9 Yt = α0 + α1Yt-1 + α2Yt-2 + . . . + αpYt-p + εt
Analyzing Building Damages of a Major Earthquake Using GRASS and R 3.3 Characteristics of Spatial Data (2) Spatial dependency or auto-correlation #6 Y (s)= xT(s)β + U(s)
3.4 Methods of Spatial Data Analysis #10 Analyzing Building Damages of a Major Earthquake Using GRASS and R
Analyzing Building Damages of a Major Earthquake Using GRASS and R Outline - 4 Introduction Chi-Chi Earthquake Spatial Data Analysis The Analysis Conclusion 4.1 Visualizing … 4.2 Exploring … 4.3 Modelling … 4.4 Discussion …
Analyzing Building Damages of a Major Earthquake Using GRASS and R 4.1 Visualizing the Spatial Data (1)
Analyzing Building Damages of a Major Earthquake Using GRASS and R 4.1 Visualizing the Spatial Data (2)
Analyzing Building Damages of a Major Earthquake Using GRASS and R 4.1 Visualizing the Spatial Data (3)
Analyzing Building Damages of a Major Earthquake Using GRASS and R 4.1 Visualizing the Spatial Data (4)
Analyzing Building Damages of a Major Earthquake Using GRASS and R 4.1 Visualizing the Spatial Data (5)
Analyzing Building Damages of a Major Earthquake Using GRASS and R 4.2 Exploring the Spatial Data (1)
Analyzing Building Damages of a Major Earthquake Using GRASS and R 4.2 Exploring the Spatial Data (2)
Analyzing Building Damages of a Major Earthquake Using GRASS and R 4.2 Exploring the Spatial Data (3)
Analyzing Building Damages of a Major Earthquake Using GRASS and R 4.2 Exploring the Spatial Data (4)
Analyzing Building Damages of a Major Earthquake Using GRASS and R 4.2 Exploring the Spatial Data (5)
Analyzing Building Damages of a Major Earthquake Using GRASS and R 4.2 Exploring the Spatial Data (6)
Analyzing Building Damages of a Major Earthquake Using GRASS and R 4.2 Exploring the Spatial Data (7)
Analyzing Building Damages of a Major Earthquake Using GRASS and R 4.2 Exploring the Spatial Data (8)
Analyzing Building Damages of a Major Earthquake Using GRASS and R 4.3 Modelling the Spatial Data (1)
Analyzing Building Damages of a Major Earthquake Using GRASS and R 4.3 Modelling the Spatial Data (2)
Analyzing Building Damages of a Major Earthquake Using GRASS and R 4.3 Modelling the Spatial Data (3)
Analyzing Building Damages of a Major Earthquake Using GRASS and R 4.3 Modelling the Spatial Data (4)
Analyzing Building Damages of a Major Earthquake Using GRASS and R 4.3 Modelling the Spatial Data (5)
Analyzing Building Damages of a Major Earthquake Using GRASS and R 4.3 Modelling the Spatial Data (6)
Analyzing Building Damages of a Major Earthquake Using GRASS and R 4.4 Discussion • Learning spatial data analysis in R: • Many duplicated functionalities are provided in various packages. • It’s very confusing for newcomers to choose a suitable package. • Comparing GRASS and R for spatial data analysis: • Some capabilities appear in both GRASS and R, too. • For those equivalent functions, R seems running faster than GRASS. • Regarding data exchange between GRASS and R: • For point vector data, it is straightforward and the “spgrass6” doesn’t seem necessary. • Additional efforts are necessary to exchange image/raster data due to R treats images as mathematical matrices.
Analyzing Building Damages of a Major Earthquake Using GRASS and R Outline - 5 Introduction Chi-Chi Earthquake Spatial Data Analysis The Analysis Conclusion 5.1 Summary 5.2 Further works
Analyzing Building Damages of a Major Earthquake Using GRASS and R 5.1 Summary GRASS and R provide researchers a powerful tool set for spatial data analysis. The analysis in this study shows that PGA is a good predictor variable in explaining the intensity of building damages in a major earthquake. This case study doesn’t find the “spgrass6” necessary in using GRASS and R for spatial data anaylsis.
Analyzing Building Damages of a Major Earthquake Using GRASS and R 5.2 Further Works Conducting related spatial analyses on area data and spatial interaction data using GRASS and R. Conducting logistic regression to explain the severity variation in the Chi-Chi earthquake building damages dataset using GRASS and R.
Analyzing Building Damages of a Major Earthquake Using GRASS and R References Earthquake. (2007, September 12). In Wikipedia, The Free Encyclopedia. Retrieved 02:19, September 13, 2007, from http://en.wikipedia.org/w/index.php?title=Earthquake&oldid=157361106 Plate tectonics. (2007, September 12). In Wikipedia, The Free Encyclopedia. Retrieved 02:49, September 13, 2007, from http://en.wikipedia.org/w/index.php?title=Plate_tectonics&oldid=157471038 Chi-Chi earthquake. (2007, July 31). In Wikipedia, The Free Encyclopedia. Retrieved 09:38, September 13, 2007, from http://en.wikipedia.org/w/index.php?title=Chi-Chi_earthquake&oldid=148197918 Active Faults in Taiwan. (2000). Central Geological Survey, Ministry of Ecnoomic Affairs, Taiwan. http://cgsweb.moeacgs.gov.tw/result/Fault/web/index-1.htm National Center for Research on Earthquake Engineering, 921 Chi-Chi Earthquake Investigation Reports, http://gisdb.ncree.gov.tw/ncree/doc/ Bailey, T.C. and Gatrell, A. C. (1995). Interactive Spatial Data Analysis. John Wiley and Sons, New York, NY. Linear regression. (2007, August 28). In Wikipedia, The Free Encyclopedia. Retrieved 03:05, September 14, 2007, from http://en.wikipedia.org/w/index.php?title=Linear_regression&oldid=154163772 Time series. (2007, September 1). In Wikipedia, The Free Encyclopedia. Retrieved 03:29, September 14, 2007, from http://en.wikipedia.org/w/index.php?title=Time_series&oldid=155004349 Trend estimation. (2007, June 21). In Wikipedia, The Free Encyclopedia. Retrieved 03:24, September 14, 2007, from http://en.wikipedia.org/w/index.php?title=Trend_estimation&oldid=139770931 Roger Bivand. (unknown). CRAN Task View: Analysis of Spatial Data. Retrieved August, 2007, from http://cran.r-project.org/src/contrib/Views/Spatial.html Baddeley, A. and Turner, R. (2005). Spatstat: an R package for analyzing spatial point patterns. Journal of Statistical Software 12:6 1-42. www.jstatsoft.org ISSN: 1548-7660. Ribeiro Jr., P.J. and Diggle, P.J. (2006) geoR : Package for Geostatistical Data Analysis, An illustrative session. geoR: A package for geostatistical data analysis using the R software www.leg.ufpr.br/geoR.
Comments and Questions Thank you for your attention