1 / 5

Achievement

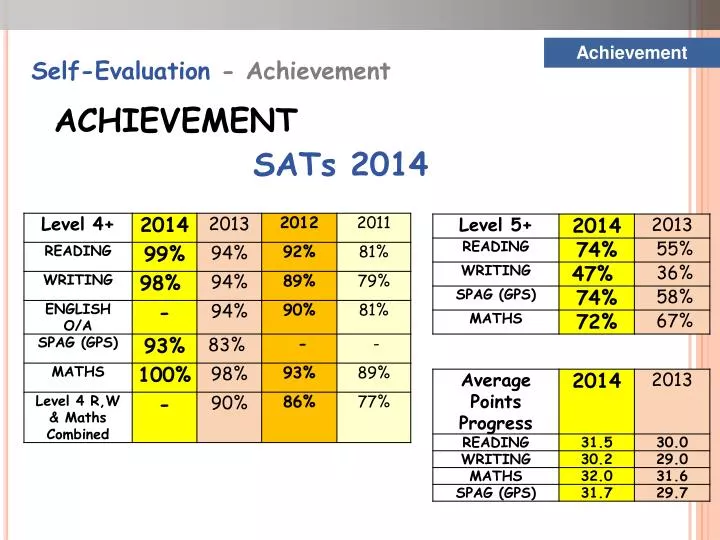
Achievement. Self-Evaluation - Achievement. ACHIEVEMENT SATs 2014. Vulnerable groups SAT data. Analysis of achievement Year 6 SATs. These charts show both the number and % of pupils making 2 levels of progress – green and > 2 levels of progress purple.

Download Presentation

Achievement

An Image/Link below is provided (as is) to download presentation Download Policy: Content on the Website is provided to you AS IS for your information and personal use and may not be sold / licensed / shared on other websites without getting consent from its author. Content is provided to you AS IS for your information and personal use only. Download presentation by click this link. While downloading, if for some reason you are not able to download a presentation, the publisher may have deleted the file from their server. During download, if you can't get a presentation, the file might be deleted by the publisher.

E N D

Presentation Transcript


  1. Achievement • Self-Evaluation - Achievement ACHIEVEMENT SATs 2014

  2. Vulnerable groups SAT data

  3. Analysis of achievement Year 6 SATs

  4. These charts show both the number and % of pupils making 2 levels of progress – green and > 2 levels of progress purple

  5. These charts show both the number and % of pupils making 2 levels of progress – green and > 2 levels of progress purple

More Related