Download
1 / 10
100 likes | 237 Views
Wave Power Potential. An energy Scenario for the UK NBS-M016 Contempory Issues in Climate Change and Energy. Wave Power: overview. Sun makes wind and wind makes waves > Waves are third hand solar energy Waves generated by wind passing over the surface of the sea

E N D
Wave Power Potential An energy Scenario for the UK NBS-M016 Contempory Issues in Climate Change and Energy
Wave Power: overview • Sun makes wind and wind makes waves > Waves are third hand solar energy • Waves generated by wind passing over the surface of the sea • direct correlation between the power of the wind and the power of the wave • Wave height determined by • wind speed, duration the wind has been blowing, depth and topography of the seafloor • Energy output (wave power) determined by • wave height, wave speed, wavelength, and water density • The energy provided most often used in • electricity generation, water desalination, and water pumps
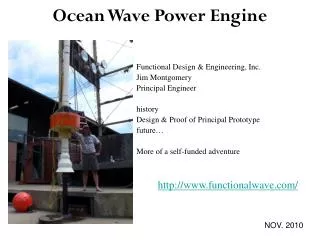
Wave Power: history • A bit of history… • First concepts 200 years ago, but viable schemes only in the 1970’ • Increased interest for RE, and specifically for wage energy, after the energy crisis in 1973, but insufficient money allocated to bring projects to maturity • 80’ because of oil price fall, wave energy funding reduced significantly • 90’ growing awareness of the potential of generating energy from waves • Relatively new renewable technology in comparison to other RE • 15-20 years behind technology wind • Long process to develop this type of energy but economics of current technologies are potentially attractive
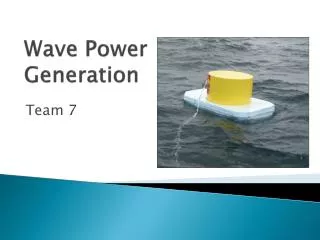
Wave devices characterized by: • Locations: • Shoreline: tethered in intermediate depths • Nearshore: fixed to the seabed in shallow water • Offshore: more difficult to construct and maintain than shoreline but greatest potential as waves in deep water have greater energy content • Method used to capture the energy (fixed, tethered, floating devices): Wave energy technology (1) 1- Buoy moored to the seabed 2- Oscillating Water Column (OWC): can be fixed to the seabed or installed on the shoreline; simple and robust 3- Floating device for offshore: use motion of waves; leading technology currently
Pelamis WEC: leading wave power technology • 4 semi submerged cylindrical sections facing nose on towards the incoming waves and which flex and bend as waves pass > this motion is used to generate electricity • world’s first commercial wave farm to generate electricity in Portugal opened in 2008: • 3 Pelamis machines with capacity of 2.25 MW (750 kW per snake); cost of 8.5 m € to deploy; project suspended in 2009 • in Scotland: plan to install the world’s largest wage farm : 3MW capacity; 4 Pelamis machines; costs 4 £m Wave energy technology (2) Source: Pelamis Wave Power 2009 http://www.pelamiswave.com/content.php?id=161 • Many devices and new technologies in emergence • But they are not technically at the industrial production stage > just pilot projects and prototypes • Wave energy is currently in the early stage of commercialisation and it is not yet a widely employed commercial technology
Worldwide potential of wave energy • Wave energy offers a large potential resources to be exploited • Total worldwide wave power estimated at 2TW (or 17 500TWh/year) - about double current world electricity production - and between 1-10 TW in deep water • Only 500 GW captured with current technology Annual average wave power density (in kW per m): any area with yearly averages of over 15kW per m has the potential to generate wave energy at competitive prices • Best wave energy sites around the world are • USA, • North & South America, • Western Europe, • Japan, • South Africa, • Australia • and New Zealand http://www.tridentenergy.co.uk/images/world_map.gif
UK has a good wave climate • Well situated: surrounded by water + good position for wind on West Atlantic Coast (smaller waves on East Coast) (Lewis 42kW/m - Cromer 5kW/m) • Waves arriving on the Atlantic Coast (1000 km) have an average power of 40kW/m • Total annual average wave power in UK West Coast • around 30 GW (260 TWh/year) at the shoreline • about 80 GW (700TWh/year) in deep water • Technical potential of offshore wave energy resource • about 7-10 GW per year (61-87 TWh/year) depending on water depth • Practical potential much smaller because of • Operational and economic constraints • Practical and technical constraints UK potential of wave energy • Potential of wave energy is huge • The extent to which this will prove practical to harness will depend upon the successful development of both near shore and deep water technologies
Constraints: • Most turbines require a constant, powerful flow > waves are irregular in both direction and power • Storms damages and corrosive power of saltwater • Devices still complicated at mechanic level and engineering difficulties • Maintenance of devices expensive • Problem of lose during conversion from mechanical energy to electricity • Advantages: • Wave energy is environmentally friendly (low noise, low visual impact, no impact for fish like tidal energy) > commercial and political attractiveness • Wave power provides the highest kW intensity per m2 • Wave available 4000 hours per year (more than wind) Wave energy: constraints and advantages
Today contribution of wage energy is very small but it will become significant in the long term: 15% in 2030 with a total wave energy devices production 50TWh • Because of the huge potential, further investment in R&D (150 m£) will be done to improve design, construction techniques, technological development, and performance • This will help to decrease the cost of wave energy (today 0,08 € kWh) and to improve the load factor • Costs of producing wave power devices will be reduced by half with R&D and economy of scale • Power of Atlantic waves is about 40kW per meter exposed coastline; UK has about 1000km of Atlantic coastline and around 60 M population • 1/60 m per person > incoming power 16 kWh per day per person • If 300 km is used for wave power and wave devices are 50% efficient at turning wave power into electricity • we will have 2,7 kWh per day per person Wave power: assumptions