Download
1 / 1
10 likes | 23 Views
Health & Disability Advocates 205 W. Monroe, 3 rd Floor Chicago, IL 60606 Phone: 312-223-9600 Fax: 312-223-9518 Email: lbarnickol@hdadvocates.org. NICU Infant Outcomes Study.

E N D
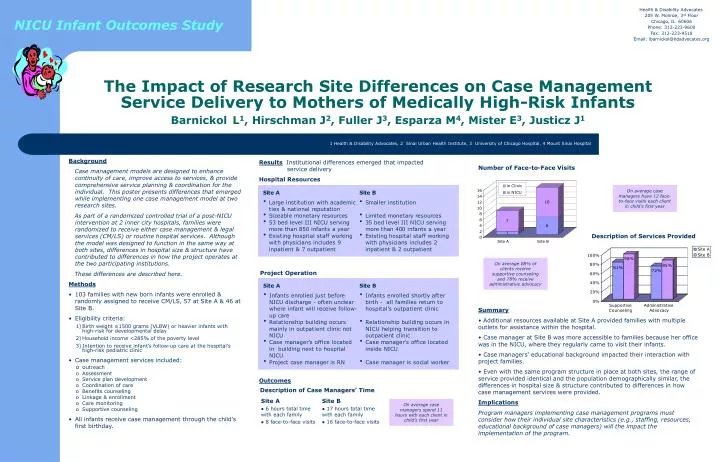
Health & Disability Advocates 205 W. Monroe, 3rd Floor Chicago, IL 60606 Phone: 312-223-9600 Fax: 312-223-9518 Email: lbarnickol@hdadvocates.org NICU Infant Outcomes Study The Impact of Research Site Differences on Case Management Service Delivery to Mothers of Medically High-Risk InfantsBarnickolL1, Hirschman J2, Fuller J3, Esparza M4, Mister E3, Justicz J1 1 Health & Disability Advocates, 2 Sinai Urban Health Institute, 3 University of Chicago Hospital, 4 Mount Sinai Hospital • Background • Case management models are designed to enhance continuity of care, improve access to services, & provide comprehensive service planning & coordination for the individual. This poster presents differences that emerged while implementing one case management model at two research sites. • As part of a randomized controlled trial of a post-NICU intervention at 2 inner city hospitals, families were randomized to receive either case management & legal services (CM/LS) or routine hospital services. Although the model was designed to function in the same way at both sites, differences in hospital size & structure have contributed to differences in how the project operates at the two participating institutions. • These differences are described here. • Methods • 103 families with new born infants were enrolled & randomly assigned to receive CM/LS, 57 at Site A & 46 at Site B. • Eligibility criteria: • Birth weight ≤1500 grams (VLBW) or heavier infants with high-risk for developmental delay • Household income <285% of the poverty level • Intention to receive infant’s follow-up care at the hospital’s high-risk pediatric clinic • Case management services included: • outreach • Assessment • Service plan development • Coordination of care • Benefits counseling • Linkage & enrollment • Care monitoring • Supportive counseling • All infants receive case management through the child’s first birthday. ResultsInstitutional differences emerged that impacted service delivery Hospital Resources Number of Face-to-Face Visits On average case managers have 12 face-to-face visits each client in child’s first year Description of Services Provided On average 88% of clients receive supportive counseling and 78% receive administrative advocacy Project Operation • Summary • Additional resources available at Site A provided families with multiple outlets for assistance within the hospital. • Case manager at Site B was more accessible to families because her office was in the NICU, where they regularly came to visit their infants. • Case managers’ educational background impacted their interaction with project families. • Even with the same program structure in place at both sites, the range of service provided identical and the population demographically similar, the differences in hospital size & structure contributed to differences in how case management services were provided. • Implications • Program managers implementing case management programs must consider how their individual site characteristics (e.g., staffing, resources, educational background of case managers) will the impact the implementation of the program. Outcomes Description of Case Managers’ Time Site A • 6 hours total time with each family • 8 face-to-face visits Site B • 17 hours total time with each family • 16 face-to-face visits On average case managers spend 11 hours with each client in child’s first year