Download

1 / 38
380 likes | 490 Views
Islamic World Science Citation Center. Scientific production of top countries in the world 2010 by Farshid Danesh ISC Academic Member October 2010. Contents Introduction some considerations about Scientific Production Data analysis. Introduction

E N D
Islamic World Science Citation Center Scientific production of top countries in the world 2010 by FarshidDanesh ISC Academic Member October 2010
Contents • Introduction • some considerations about Scientific Production • Data analysis
Introduction • The statistical analysis of scientific literature began in the first quarter of the 20th century by comparing the scientific productivity of several countries, based on the works published. • The interest was very low. The appearance in 1963 of the Science Citation Index database produced by the Institute for Scientific Information (ISI) constituted a turning point for scientists and managers all over the world. • The database provided an instrument of quantitative evaluation for studies regarding the development of science. The ISI started the database by collecting information from 2300 journals.
The term, bibliometrics, is defined as ‘the application of mathematical and statistical methods to books and other means of communication, which are mainly in charge of the management of libraries and documentation centers’, while scientometrics refers to ‘those quantitative methods which are used in the analysis of science regarded as a process of information’. • Although bibliometric and scientometrics methods are similar, scientometrics analyses the quantitative aspects of generation, dissemination and utilization of scientific information in order to contribute to the understanding of the mechanism of scientific research.
The number of scientific works published by a scientist is not enough to obtain significant statistical data in the scientometric evaluation of a scientific community. • These communities include research groups, departments of universities, institutions, corporations, societies, countries, geopolitical regions, scientific fields or subfields. • The primary scientific data of any scientometric investigation are represented by all the authors, their works, their bibliographical and the citations they receive.
At the national level, the data and resulting indicators suggest ways to compare scientific impact, output and productivity with other countries and to justify federal spending on scientific research. • Bibliometrics and scientometrics are a set of methods for measuring the production and dissemination of scientific knowledge. • The evaluation of the performance of scientific research is the most important application of scientometrics. • Recently, interest grows in the use of scientometrics techniques for the measurement the efficiency and productivity of the research.
Derek de Solla Price and Vasilij Vasilevich Nalimov were the originators of the discipline, which they developed for the purpose of providing research tools to historians and sociologists of science. • Eugene Garfield, that the use of bibliometrics became widespread. • With their systematic archiving of articles from a selection of some of the most prestigious and most often cited scholarly journals, the Thomson ISI databases considerably reduce the effort required to carry out bibliometric analysis.
The field grew out the sociology of science, information science and library science, but it quickly carved out a place for itself in quantitative research evaluation. • Bibliometrics is based on two assumptions: (1) the goal of researchers is to advance knowledge, and this means disseminating the results of their research and studies through a variety of communication media, including writing, which lies at the core of the academic tradition; (2) scholars have to publish in order to build a reputation and advance their careers.
A publication count is one means of measuring and comparing the production of various aggregates such as institutions, regions and countries. • It can also be used to evaluate output in individual disciplines, such as philosophy and economics, and to track trends in research fields, collaborative research and many other aspects of research output. • bibliometric analyses can be conducted on manually compiled data, they are usually based on databases that in many cases exist primarily for bibliographic purposes.
The most commonly used databases in bibliometrics analyses are the ones produced by Thomson ISI. Established scholars select the journals to be covered in cooperation with users, publishers and members of editorial boards. • Selection criteria include publication frequency, compliance with international presentation conventions, existence of an English abstract, and a peer review committee. • The most bibliometric studies are based on one or more of the Thomson ISI databases: the (SCI), (SSCI), and (AHCI).
They are particularly useful for a number of reasons: • Their primary advantage is coverage. They cover all research fields, giving ready access to aggregated data. • The criterion for including a journal in SCI and SSCI is the number of citations it receives. • The Thomson ISI databases contain the institutional addresses for all authors of a given article. Other databases usually contain only the address of the first-named author. • Only the Thomson ISI databases contain citation information, which makes it possible to measure research impact.
At the same time, the Thomson ISI databases have some disadvantages: • First, their coverage is not as deep as some of the specialized databases. • Second, they are relatively costly to use because they are produced by a private company . • Third, they are not as suitable for SSH research as they are for research in the natural sciences.
Scientific Production • Scientific production refers to all the output resulting from research projects: publications, prototypes, patents, software applications, hardware, etc. • The scientific production is an important indicator of the development level in any country, being at the present moment quantified by the Institute for Scientific Information.
Take into consideration several aspects: • The scientific production of a university represents a fundamental component of the university mission. • The scientific production has an intangible and a tangible nature. • The evaluation of the scientific production is made at the present moment only at the tangible level. • The scientific production differs from one field to another. • Any university ranking based on the scientific production is relative.
Conclusions of this part … • The analysis of the scientific production is a difficult process and is done only at tangible level, at least for now. • The most used methods imply the number of scientific articles published in journals indexed in different databases (for example Science Citation Index).
However, there are different fields and the scientific production in each of those fields has some particularities, which need to be taken into consideration, in order to be realistic and as rigorous as possible. • Any ranking based on the scientific production is relative and its analysis makes sense only in the reference system defined from the beginning
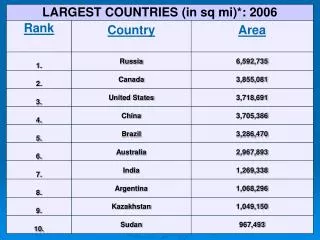
Table1. Ranking of top 15 countries’ scientific production in 2010