Download
1 / 35
360 likes | 378 Views
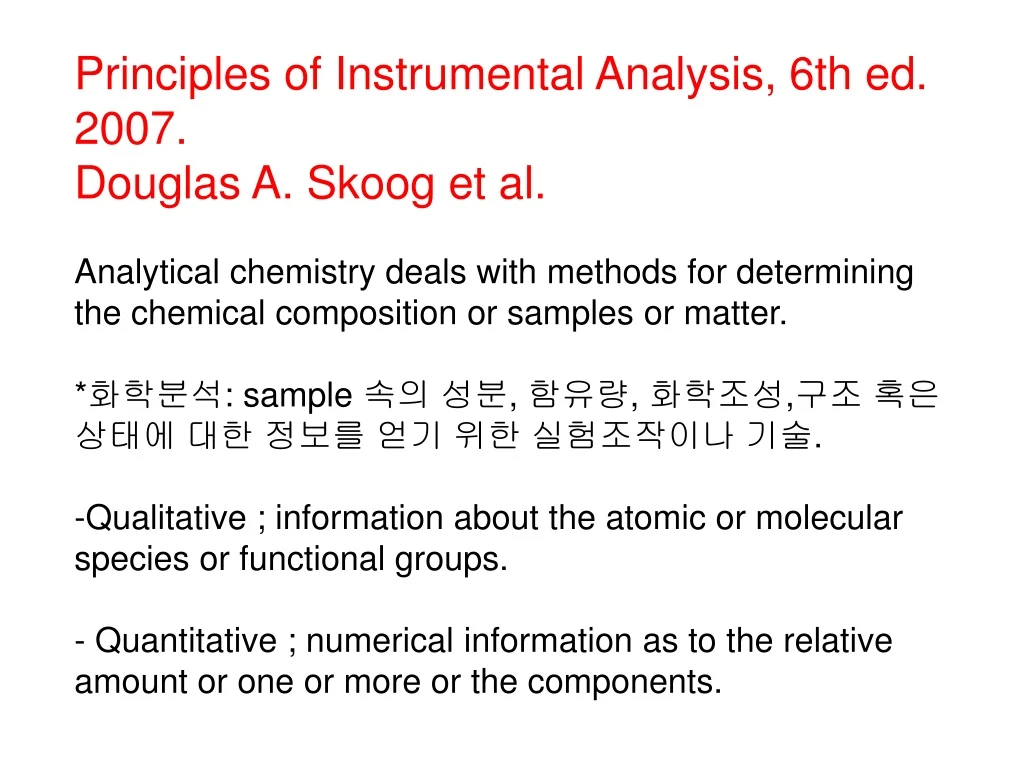
Principles of Instrumental Analysis, 6th ed. 2007. Douglas A. Skoog et al. Analytical chemistry deals with methods for determining the chemical composition or samples or matter. * 화학분석 : sample 속의 성분 , 함유량 , 화학조성 , 구조 혹은 상태에 대한 정보를 얻기 위한 실험조작이나 기술 .

E N D
Principles of Instrumental Analysis, 6th ed. 2007. • Douglas A. Skoog et al. • Analytical chemistry deals with methods for determining the chemical composition or samples or matter. • *화학분석: sample 속의 성분, 함유량, 화학조성,구조 혹은 상태에 대한 정보를 얻기 위한 실험조작이나 기술. • Qualitative ; information about the atomic or molecular species or functional groups. • - Quantitative ; numerical information as to the relative amount or one or more or the components.
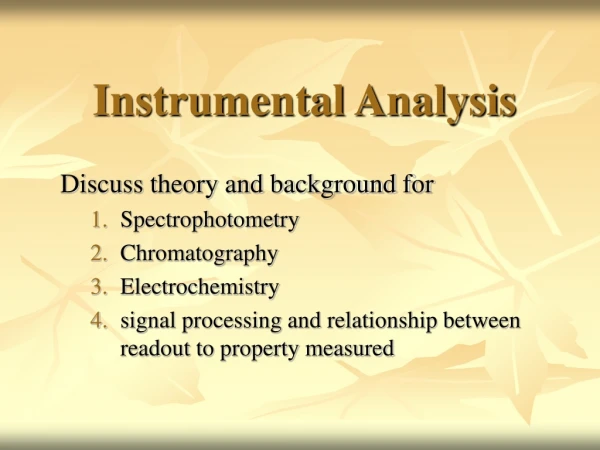
1A Classification of Analytical Methods 1. Classical methods: ㉠qualitative - the separated components reagent ① druel of wamet or colors ② bp. or mp. ③ solubilities in solvents ④ odors ⑤theoretical activities or ⑥the refractive index. ㉡quantitative - gravimetric & volumetric 2. Instrumental Methods - measurements of physical properties of analytes or conductivity, electrode potential, light absorption or emission mass - to - charge ratio, Fluorescence, chromatography, etc..
1B Types of Instrumental Methods I) Spectroscopy Ii) Electrochemical methods Iii) Chromatography Iv) Mass spectrometry V) Thermal methods Vi) Radioactovity Vii) Rate of reaction Viii) Microscope
i) Sprctroscopy a) emission of radiation --- Emission spectroscopy ( X-ray, UV, visible, electron, Auger) --- Fluorescence and phosphorescence spectroscopy (X-y,UV,visible) --- Radiochemistry b) absorption of radiation --- Spectrophotometry ( X-ray, UV, visible, IR ) --- Photoacoustic spectroscopy --- Nuclear magnetic resonance and electron spin resonance spectroscopy c) scattering of radition --- Tubidimetry --- Nephelometry --- Raman spectroscopy
d) refraction of radiation --- Refractometry --- Interferometry e) diffraction of radiation --- X-ray and electron diffraction methods f) rotation of radiation --- Ploarometry --- Optical rotatory dispersion --- Circular dichroism
ii) Electrochemical a) electrical potential --- Pltentiometry --- Chronopotintiometry b) electrical current --- Polarography ( normal - differential pulse, classical…) --- Amperometry (cyclic voltammetry, strriping voltammetry, chrono-…) c) electrical resistance --- Conductometry --- Oscillometry
iii) Chromatography a) liquid chromatography --- Liquid - liquid (LLC) --- Liquid - solid (LSC) --- Liquid - bonded phase (LSB) --- Ion - exchange (IEC) --- Gel - permeation (GPC) b) gas chromatography --- Gas - liquid (GLC) --- Gas - solid (GSC) --- Gas - bonded phase c) electrophoresis
iv) Other methods a) mass spectrometry b) thermal methods ; TG, DSC, DTA, etc. c) mass ; Gravimetry (quartz crystal microbalance) *** Fig.4 Components of a typical instrument*** v) Rate of reaction ; kinetic methods vi) Radioactivity ; Activation & isotope dilution methods
*기기분석: 물리적, 물리화학적 방법을 이용한 화학저울보다 일반적으로 복잡하고 값비싼 기재를 이용하여 분석 1860년 : Cs, Rb 발견 - 불꽃 광도법 시험 1927년 polarography 1940,41년: Beckmann 사에서 불꽃광도계 상품화 ………… 장점 : 1) 선택성 大 2) 시간단축 3) 조작용이, 개인차 小 4) sensitivity 大 5) 자동화, 연속화 가능 6) 비파괴 분석 가능 단점 : 표준물질, 분석치의 유효숫자 小 기기조절 大 부수유지 난이
분석기기의 구성 • Signal generator, Analytical input, Electrical generator, Signal transduce or Signal output or Mechanical process, Signal detector. • A. Signal generator • ex) pH변화, 기체의 열전도율, 불꽃세기의 강도 용액에 흡수되는 광선의 강도 • energy source, optical system • B. Detectors (input Transducers) • A transduce is a device that converts one of energy to an other. • i.e thermocouple, a photocell, the beam or a balance. • detector : transducers that act on a chemical signal. • analytical signal - electrical voltage or current • ex) 광전지, 광전관, 유리전극
C. Circuits - output signal ex) 1) converting circuit : 전류 - 전압, 직류 - 교류 2) amplifying circuit : 필요한 수준까지 충족 3) computing circuit : 표준과 비교, 미분, 적분.. 4) assistant circuit : wave generation 5) power supply circuit : 위의 회로 동작을 위한 전원 D. Readout Devices (output의 표시) ex) Analog meter: Digital meter, Oscilloscope,Recorder E. Microprocessors and computers in instruments - op amp. IC, A/D and D/A converters counters, microprocessor, and computers.
분석기기의 성능판정 (신뢰성, 측정방식) A 기기의 신뢰성 1) 타당성 - 감응도, 감동 , 응답 2) 정확도 - bias가 적은편 3) 정밀도 - dispersing 이 적은편 정밀도: repeatability(반복정도) : 동일한 실험과 동일한 조건 reproducibility (재현정도) : 상이한 실험과 상이한 조건 B 측정방식 1) direct presentation 2) Null balance: bridge, potentiometer 1) single channel : 입력실험과 하나인 것 2) double channel : 기준과 신호의 양쪽 입력신호를 각각 두개의 변환기로 받아서 이두 입력신호의 차 또는 비준 측정 두 변환기의 성능 차에 의한 오차 해결책 : 변환기 사용 - 기준과 시료를 교차시켜 통과 - 출력: 자동 평형형, 주사형
i) precision absolute standard deviation relation standard deviation standard deviation of to mean cooggicient of variation bariance ⅱ) Bias bias = u - xi population mean ⅲ) sensitivity limit ; - the slop of calibration curve - the reproducibility of the measuring device. calibration S = mc + Sbl, Cx=(Yc-b)/m s : the measured signal c : the concentration of the analyte sbl : the instrumental signal for a blank m : the slop of the strait line Analytical sensitivity ; r = m/Ss Ss = the standard deviation of the signal
ⅳ) Detection Limit →the a minimum concentration or weight of analyte that can be detected at a known confidence level. -mean blank signal Sm = Avg(Sbl) + k Sbl standard deviation of minimal distinguishable analyte signal Sm - Sal Def. Cm = ------------ m ⅴ) Applicable concentration range The Loncer limit of QM is taken as being signal to ten times the standard deviation when the analyte concentration is zero. ⅵ) selectivity A: analyte B&c S: mACA + mBcB + mCcC+ Sbl kb, a = mB/mA S.C.for B kc, a = mC/mA S = mA (cA + kB,A cB + kC,AcC) + Sbl
S = kVsCs/Vt + kVxCx/ Vt , m = kCs/Vt , b=kVxCx/Vt , b/m = VxCx/Cs Calibration plot for the standard addition method