Download
1 / 33
330 likes | 423 Views
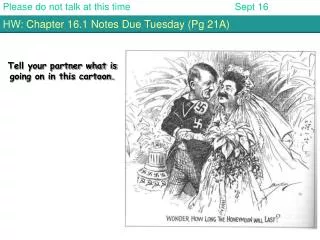
HW: Make Your EFFECT Charts even better and more complete. Please do not talk at this time Jan 12. Get out your homework chart on England and Japan. Get out all your notes on Industrialization in England Get out all your placard charts from the Industrial Revolution Unit

E N D
HW: Make Your EFFECT Charts even better and more complete Please do not talk at this time Jan 12 Get out your homework chart on England and Japan. Get out all your notes on Industrialization in England Get out all your placard charts from the Industrial Revolution Unit Use these sources and your text book to brainstorm as many EFFECTS of Industrialization on the world as you can think of. List your ideas on a piece of paper. You may work with a partner.
Now turn your lists into bubble graphs! Power looms Weavers out of work Women join the work force Make Affordable cloth Prove they can work as well as men Working moms can’t take care of their babies New inventions improve lives Everyone can afford enough clothes Get paid less than men Factory owners get rich Telegraph Child Labor Lets people communicate quickly Get paid almost nothing I will give you Big Paper for Big Answers Vaccinations for Smallpox Saves lives from disease Children are beaten Get no education
Keep going! Don’t forget to include Japan and the effects of industrialization there! Focus Questions: • What technology was invented during the IR. How did it effect people’s lives? • Where did people live? What were their homes like? • What kind of work did they do? Was it enjoyable? Was it dangerous? How? • What was your life like if you were rich? • What was your life like if you were poor? • What effect did education have at this time? In England? In Japan? • What rights did people have? • What illnesses did people suffer. How did those affect their lives? Remember… Be Specific! Use details and facts!
Please do not talk at this time. Jan 13 HW: Turn your 3 best bubble graphs into outline form. • Please review your reading on Japanese Industrialization to prepare for the quiz. • You will also need your Giant Bubble graph paper and your homework Bubble graphs ready for the next part of the lesson, so get those ready. • Please also prepare a half sheet for your quiz (you can share with a friend) and number it 1-5.
Japanese Industrialization Quiz • The name of the man who opened Japan to the west was _____________ • The name of the Emperor of Japan during industrialization was________ • This warrior group helped the Emperor overthrow the Shoguns. • True/False Women made up most of the factory work force in Japan. • One drawback the Japanese experienced from taking technology and innovations from so many different countries was __________
Please trade papers with someone near by… • Write your name after the words “Corrected By:” • Please put a line through incorrect answers and write the correct ones.
Japanese Industrialization Quiz Answers • The name of the man who opened Japan to the west was Commodore Mathew Perry • The name of the Emperor of Japan during industrialization was Meiji • This warrior group helped the Emperor overthrow the Shoguns. Samurai • True/False Women made up most of the factory work force in Japan. • One drawback the Japanese experienced from taking technology and innovations from so many different countries was __________ Possible answers: Risk of losing their culture, danger of being taken over by foreigners, and other answers…
Title: Main Idea/Detail- Outline Practice • Open your notebook to Pg. 54A and copy this list: Trees Snow Ice Crystals Green White Leaves Branches Fur Bear Flowers Pink Fruit Cold Teeth Bark Sharp • Now find the connections between these words. Circle words and draw lines between words that are related. Like this: Trees Snow Ice Crystals Green White Leaves Branches Fur Bear Flowers Pink Fruit Cold Teeth Bark Sharp Notice: Sharp connects to teeth, not fur… What does this look like? You are right! It looks like a bubble graph!
Title: Main Idea/Detail- Outline Practice The indentations and numbers of an outline have meaning. Indentations mean “This thing describes or explains the thing above. The numbers show the level of detail. The bigger the number type (Roman Numeral, Capitals) the more general the information (this makes it the main idea) The smaller the number type (lower case, regular numbers,) the more specific the information. So, in this example: A and B explain or describe I and the first 1explains or describesA while the second1and2explain or describeB • Main Idea • Detail 1. Specific • Detail 1. Specific 2. Specific Now we want to create an outline. Outlines are organized like this: • Main Idea • Detail 1. Specific • Detail 1. Specific 2. Specific
Title: Main Idea/Detail- Outline Practice • Bubble graphs are related to outlines. They show the same information: Main ideas and their supporting explanations, details and specifics. Trees Snow Ice Crystals Green White Leaves Branches A. Fur I. Bear Flowers Pink Fruit Cold B. Teeth Bark 1. Sharp Now you try it with the other examples….Turn your bubble graphs into Outlines…
I. Trees A. Leaves 1. Green B. Branches 1. Bark C. Fruit D. Flowers 1. Pink OR Does yours look like this? I. Snow A. Ice Crystals B. White C. Cold OR I. Snow A. Ice Crystals 1. Cold B. White I. Trees A. Bark B. Branches 1. Leaves a. Green 2. Fruit 3. Flowers a. Pink I. Bear A. Fur B. Teeth 1. Sharp
Find your partners from Monday!Look over your homework bubble graphs.Pick your BEST ones (rich in detail, insight and specifics) and put those on your poster paper.Put your Absolute Best one on the board
Look at your bubble graphs…. • Which bubbles are Main Ideas? • Which bubbles are Details? • Which bubbles are Specifics • Take your top Three Bubble Graphs and turn them into outlines for homework tonight.
Please do not talk at this time Jan 14 - 15 HW: Finish Core and Periphery Reading • Please get together with your partners. • Look at your outlines and Bubble Graphs • Choose the BEST Bubble Graph/Outline pair from your team (best means clearest, most understandable, not most complex) • Send someone from your group to put up BOTH your bubble graph and your outline on the board. Write clearly enough that people will be able to read it. Share out… Look for specifics, if they are not there, lets add them together, then practice on our own.
British Imperialism in India:Cotton and the Creation of a Core and Periphery
Name: Core/Periphery Key Words, ??? Notes, diagrams, charts Vocab Definition Summary: • Please set up your notes in the Cornell notes form on Pg. 55A of your notebook. • Title these notes: Core and Periphery • Write the ASQ and BSQ questions on the left side of the notes and answer them on the right side. • Don’t forget to do the Summary at the end of the day!
Words you will need to know for this lecture… • Core-at the center • Periphery- in the outskirts, opposite of core, at the edge • Subsistence Farming- Growing food to eat yourself • Cash Crop- Growing a plant to sell, like cotton or tobacco, that cannot be eaten • 1st world countries- The industrialized nations, mostly North America, Europe, and Japan • 3rd world countries- Nations that have not yet fully industrialized or do not control the industry in their own countries, most of Africa and the Middle East, Most of South Asia, Parts of South America
Cotton ASQ! • Where was most cotton produced before the U.S. Civil War? • Who purchased most of that cotton? • What was it used for?
During the Civil War (1861-1865), the South couldn’t export cotton to Great Britain. The factory owners in Great Britain were desperate to obtain cotton. • What do you think they decided to do?
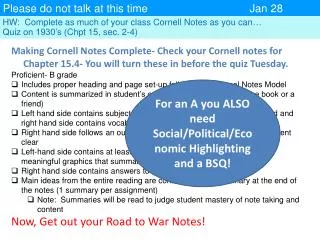
5. What does this graph show? Table 1: Cotton Exports from India, Egypt, and Brazil, 1860–1866, in Million Pounds. Sources: Government of India, Annual Statement of the Trade and Navigation of British India and Forign Countries vol. 5 (Calcutta, 1872); vol. 9 (Calcutta, 1876); Roger Owen, Cotton and the Egyptian Economy, 1820–1914 (Oxford, 1969), 90; Estatisticas historica do Brasil (Rio de Jeneiro, 1990), 346.
Subsistence farming vs cash crops More cotton = less food 6. What might be the consequences of the shift from subsistence farming to cash crops?
Drop in food production + El Niño weather patterns = Famine 7. For the people of India, what were the consequences of increased cotton production for export?
Estimated Famine Deaths in India Total 12.2-29.3 million Statistics from Mike Davis, Late Victorian Holocausts: El Nino Famines and the Making of the Third World (London: Verso, 2001), p. 7.
De-Industrialization in India India’s Share of World Manufacturing Output 8. Did India’s economy benefit from being a British colony? (use your prior knowledge to answer this fully) Statistics from Mike Davis, Late Victorian Holocausts: El Nino Famines and the Making of the Third World (London: Verso, 2001), p. 294.
Core – industrialized nations like Great Britain, America, Germany, and Japan Periphery (Peripheral) – countries that provided raw materials to the industrialized nations; very slow to begin industrializing themselves Core (Great Britain) Periphery (India, Egypt) Core and Periphery as Social Studies Terms
“We are not dealing, in other words, with “lands of famine” becalmed in stagnant backwaters of world history, but with the fate of tropical humanity at the precise moment (1870 – 1914) when its labor and products were being dynamically conscripted into a London-centered world economy. Millions died, not outside the “modern world system,” but in the very process of being forcibly incorporated into its economic and political structures.” - Mike Davis, Late Victorian Holocausts
Analysis: “A key thesis of this book is that what we today call the “third world” is the outgrowth of income and wealth inequalities – the famous “development gap” – that were shaped most decisively in the last quarter of the nineteenth century, when the great non-European peasants were initially integrated into the world economy…By the end of Victoria’s reign…the inequality of nations was as profound as the inequality of classes. Humanity had been irrevocably divided. And the famed “prisoners of starvation,”…were as much modern inventions of the late Victorian world as electric lights, Maxim guns and “scientific” racism.” -Mike Davis, Late Victorian Holocausts
Please do not talk at this time Jan 16 HW: Evaluate the Industrial Revolution Outline- Typed! • Get out your reading on Core and Periphery • Look at the notes you took last night (Main ideas and evidence.) Which ones are really high quality information? • Find your partners and share your work • Take your best ones (clear, significant and with rich Facts, Specifics, Statistics) and turn these into Bubble graphs on your Bubble graph Poster.
+/- Put a + in the bubbles with a positive effect. Power looms Weavers out of work Women join the work force Make Affordable cloth + + Prove they can work as well as men Working moms can’t take care of their babies New inventions improve lives Everyone can afford enough clothes + Get paid less than men Factory owners get rich + Telegraph Child Labor Lets people communicate quickly + Get paid almost nothing Vaccinations for Smallpox Saves lives from disease Children are beaten Get no education +
+/- Put a - in the bubbles with a positive effect. Power looms Weavers out of work Women join the work force - Make Affordable cloth + + - Prove they can work as well as men Working moms can’t take care of their babies New inventions improve lives Everyone can afford enough clothes + Get paid less than men - Factory owners get rich + Telegraph Child Labor Lets people communicate quickly + - Get paid almost nothing Vaccinations for Smallpox - Saves lives from disease Children are beaten Get no education + -
Now you have all the research your need to write your evaluation. • Put your bubble graph up on the wall with tape and staples. • Go around and gather information from other posters that will help make your own information more complete (look for even more facts, specifics, and statistics to add to your main ideas) • When you have all that you need, start work on your outline worksheet!