Download
1 / 13
130 likes | 388 Views
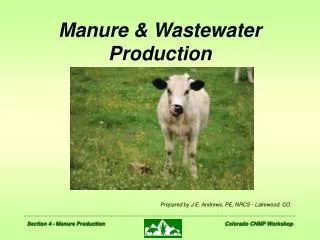
Daily Manure Production Per Animal. We have estimates of manure production 4.5 kg/day/hd for swine (liquid manure) 45-50 kg/day/hd for dairy cow (liquid) 25-30 kg/day/hd for beef cow (liquid) Solid portion ~ 13-15% of total. Animal Waste Nutrient Utilization Scenario.

E N D
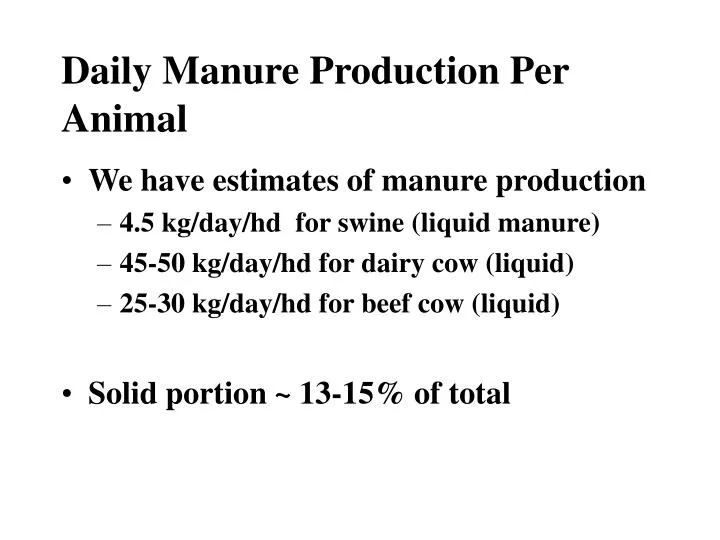
Daily Manure Production Per Animal • We have estimates of manure production • 4.5 kg/day/hd for swine (liquid manure) • 45-50 kg/day/hd for dairy cow (liquid) • 25-30 kg/day/hd for beef cow (liquid) • Solid portion ~ 13-15% of total
Animal Waste Nutrient Utilization Scenario • Swine Confinement Facility • 4000 animals @ 61 kg / animal • Nutrient Content in kg/ day / 1000 kg • 0.52 kg N / day / 1000 kg animal wt. • 0.18 kg P / day / 1000 kg animal wt. • 0.29 kg K / day / 1000 kg animal wt.
Manure Characteristics • In general… • Nitrogen (ammonia) is in urine • Phosphorus is in feces • In the U.S. we’re working on ways to keep urine and feces separate
Manure Management Issues • Animal manure is a liability in high density livestock production areas where fertilizers are cheap • Animal manure is an asset if fertilizers are unavailable or expensive • Odor and ammonia emission to air-global warming • Odor issues are serious in residential areas • Pollution of soil and water resources-water quality • Hypoxia problems in international water
Nitrogen • Is mobile in some forms (NO3) • not in others (organic, NH4) • Does not carryover like P • Is not determined by soil test
Negative Environmental Impacts • Nitrogen • - Nitrates leaching to tilelines and/or groundwater • - Ammonia runoff into surface water • causing fish kills
Negative Environmental Impacts • Phosphorus • Loss with soil erosion • Eutrophication (algae growth) of surface waters
Phosphorus • Is bound to the soil particles • Remains in the soil year to year • Moves if soil erodes • Is determined by soil test • Does not volatilize like nitrogen
Manure Nutrient Planning Determine the hectares needed to maximize nutrient use and minimize negative environmental impacts
Question 1 Which Nutrient should I use for planning... Nitrogen? Phosphorus?
U.S. Manure Law says... • Use nitrogen for nutrient planning • - Results in least land area needed • - May not be best use of nutrients because phosphorus is overapplied • - Laws in U.S. are changing to require P planning
N:P Ratio of Manure • N:P ratio is different for different types of manure • N:P • Cattle ratio… ~ 2:1 • Swine ratio… ~ 1.5:1 • Poultry ratio… ~ 1:2
Phosphorus Planning • Requires more hectares • Results in lower application rates • Maximize economic value of manure • Depends on crop & manure application frequency • Requires additional commercial N fertilizer