Download
1 / 16
160 likes | 243 Views
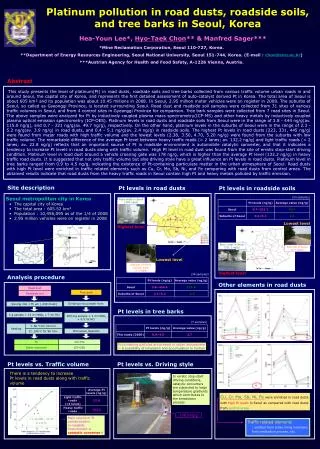
10 . 6 . 200 8. IMPACTS OF TRAFFIC VOLUMES AND WIND DIRECTIONS ON AIR POLLUTION CONCENTRATIONS IN SEOUL, KOREA. Youngkook Kim * Jean-Michel Guldmann * Hui-Mun Ra* *. * Ph.D. Candidate and Professor in Department of City and Regional Planning, OSU

E N D
10. 6.2008 IMPACTS OF TRAFFIC VOLUMES AND WIND DIRECTIONS ON AIR POLLUTION CONCENTRATIONS IN SEOUL, KOREA Youngkook Kim* Jean-Michel Guldmann* Hui-Mun Ra** * Ph.D. Candidate and Professor in Department of City and Regional Planning, OSU ** Assistant Professor in Dept. of Public Administration, Sungkyul University, Anyang, S. Korea
I. Introduction Transportation is known to be responsible for a substantial share of urban air pollution such as carbon monoxide (CO), nitrogen oxides (NOx), volatile organic compounds (VOC), particulate matter (PM), and sulfur dioxide (SO2), 1 Share of emission from transportation a) Sources: EPA (2000), Korea Ministry of Environment (2005) b) Includes on-road and off-road engines and vehicles. c) Includes on-road vehicles only.
It is reasonable to expect that, as vehicle-kilometers-traveled (VKT) increase, ambient air pollution concentrations also increase. 1 Purposes • Estimate hourly VKT around air quality monitoring stations (AQM) • Hourly VKTs are weighted by wind direction frequencies • The relationships between AQM pollution concentrations, WD-weighted and un-weighted VKTs are investigated
II. Research Method & Data Location of AQMs, Circular Buffers, and Assigned Traffic Flows 2
II. Research Method & Data Research framework 2
III. Traffic flows vs. Pollution concentration 1) Hourly NO2 concentrations and Traffic Counts 3
III. Traffic flows vs. Pollution concentration • Positive impacts on NO2 concentration • Negative impacts on NO2 concentration 3
III. Traffic flows vs. Pollution concentration 2) Hourly CO concentrations and Traffic Counts 3
III. Traffic flows vs. Pollution concentration 3) Hourly SO2 concentrations and Traffic Counts 3
III. Traffic flows vs. Pollution concentration 4) Hourly PM10 concentrations and Traffic Counts 3
III. Traffic flows vs. Pollution concentration 5) Hourly O3 concentrations and Traffic Counts 3
V. Conclusion • Relations between hourly VKTs and air pollution concentration • Positive relationships with NO2, SO2, CO, and PM10 concentrations • On the other hand, O3 concentration is negatively correlated with VKTs • WD-weighted impacts on pollution concentration • WD-weighted VKTs increase explanatory powers in most cases • In the case of O3, however, WVKTs during the afternoon 8 hours do not enhance model predictability, which calls for further research 5