Download
1 / 87
870 likes | 1.08k Views
Clean Air Act Amendments, Wilderness Act, and Organic Act have mandates to protect Class 1 Areas. Clean Air Act Preserve, protect and enhance air quality... and protect air quality related values (soil, water, flora, fauna, visibility)... in national parks…. Wilderness Act :

E N D
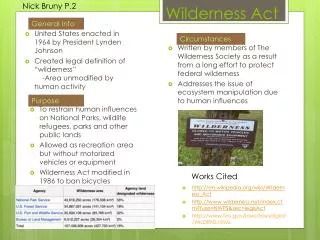
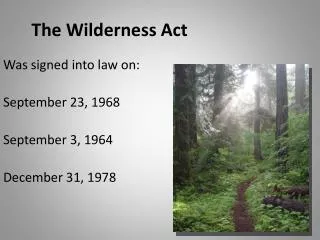
Clean Air Act Amendments, Wilderness Act, and Organic Act have mandates to protect Class 1 Areas Clean Air Act Preserve, protect and enhance air quality... and protect air quality related values (soil, water, flora, fauna, visibility)... in national parks… Wilderness Act: Areas are “administered… in such a manner as will leave them “unimpaired for future use and enjoyment as wilderness” Organic Act: Leave resources “unimpaired for the enjoyment of future generations”
Loch Vale Watershed Foundations • 22+ years of long-term monitoring • Experiments in field and laboratory to test cause and effect • Modeling of ecosystem processes and “what-if” scenarios • Spatial comparisons in Colorado and across western US Invaluable dataset for answering many different questions! Started with acid rain, now used for nitrogen saturation, mercury deposition, climate change, fundamental hydrology, biogeochemistry, and ecology.
Loch Vale Watershed Conceptual Model Precipitation Vegetation Bedrock Bedrock Soils Soils Freshwater Sediments Biota Outflow
Ecological Effects of Nitrogen Deposition at Rocky Mountain National Park Jill S. Baron, US Geological Survey M.Hartman, D.S.Ojima, K. Nydick, H.M. Rueth, B.Moraska Lafrancois, A.P. Wolfe, J. Botte, W.D. Bowman
N Deposition Fertilization Loss of Soil Buffering Changes in Plant Communities N Saturation Lake Eutrophication Changes in Aquatic Species Loss of Lake ANC (acidification) Pathways and Effects of Excess Nitrogen Deposition
In the alpine nitrogen favors sedges and grasses over flowering plants Niwot Ridge research shows sedges and grasses grow better with N than flowering plants in both experiments and surveys (Korb and Ranker 2001; Bowman et al. in press)
East-side forests are closer to N saturation Six pairs of sites were similar in all characteristics except for N deposition amount N. Doesken East side stands differed significantly from west side forests: - higher needle and soil N, - lower C:N ratios, - higher soil N cycling rates Baron et al. 2000, Rueth & Baron 2001, Rueth et al. 2003
As soils accumulate N, microbial activity increases Colorado Front Range Baron et al. 2000 Rueth & Baron 2001 Similar patterns in New England, USA McNulty et al. 1991
Nitrate in ROMO Means (ueq/L) East 10.5 (5.0) West 6.6 (4.3) n=44, p = 0.02 Clow et al. 2001 Baron et al. 2000
Watershed Nitrogen Saturation 10 9 North American watersheds 8 7 6 N export, kg/ha/y 5 Loch Vale 4 3 2 1 0 0 1 2 3 4 5 6 7 8 9 10 11 12 13 14 N wet deposition, kg/ha/yr after Stoddard, 1994
Loch Vale nitrate isotopes, 1995 100 60 20 -20 -4 -2 0 2 4 6 d15N (NO3) Winter snow Rainfall d18O (NO3) Snowmelt Spring snow Streams Groundwater Microbial nitrate
Nitrate concentrations are increasing in Loch Vale streams ANDREWS CREEK Alpine 1992-1998 mean =~25 ueq/L THE LOCH OUTLET Subalpine 1992-1998 mean =~16 ueq/L
Lake sediments extend records into the past Wolfe et al., 2001, 2003, Das et al. 2005 Saros et al. 2005, Baron et al. 1986
Diatoms are good indicators of environmental change • Diatoms are algae: single-celled aquatic plants • Species are very sensitive to water chemistry • Glass (silica) cell walls do not decompose • Each species has unique cell walls
Diatom Indicators of Disturbance Increased Abruptly in east-side lakes ca. 1950-1960 1950 Sky Pond Asterionella formosa Fragillaria crotonensis Aulacoseira spp.
Experiments with Bioassays (Bottles), Mesocosms (Hula Hoops), and Lakes Lafrancois et al. 2003, 2004, Nydick et al. 2003, 2004a, b
Experiments: Productivity increased with added N and N+P. Communities changed to nutrient-loving algae. Green Algae Chlamydomonas sp. Chrysophytes Dinobryon sp. N Additions= Eutrophication increased productivity changed algal community
Conclusions On the east side of the Front Range changes have been observed in: • Alpine tundra • Forests • Soils • Lakes and streams • Lake biota • Experiments support nitrogen as the cause
What Happens Next? Nitrate is a strong acid anion. Nitrogen saturation leads to acidification. Hundreds of studies funded by NAPAP and its European counterpart show strong biological responses to acidification.
EutrophicationAcidification • Depletion of base cations, mobilization of aluminum • Forest dieback • Episodic/chronic acidification of waters • Declines in species richness and abundance • Loss of fish • Changes in species • Increased productivity • Increased microbial activity • Increased soil N • Nitrogen saturation Increased N and acid deposition Reversal?
Nitrogen emissions, transport, and deposition Don Campbell Dave Clow Alisa Mast George Ingersoll Leora Nanus NPS, USDA-FS, EPA, NSF, Universities Colorado DPHE & local partners
Total NOx emissions -- includes mobile and non-point sources
National Atmospheric Deposition Program / National Trends Network 1984 1986 Nitrate Ion Concentrations 1985-2003 1985
1985 1987 Nitrate Ion Concentrations 1985-2003 1986
1986 1988 Nitrate Ion Concentrations 1985-2003 1987
1987 1989 Nitrate Ion Concentrations 1985-2003 1988
1988 1990 Nitrate Ion Concentrations 1985-2003 1989
1989 1991 Nitrate Ion Concentrations 1985-2003 1990
1990 1992 Nitrate Ion Concentrations 1985-2003 1991
1991 1993 Nitrate Ion Concentrations 1985-2003 1992
1992 1994 Nitrate Ion Concentrations 1985-2003 1993
1993 1995 Nitrate Ion Concentrations 1985-2003 1994
1994 1996 Nitrate Ion Concentrations 1985-2003 1995
1995 1997 Nitrate Ion Concentrations 1985-2003 1996
1996 1998 Nitrate Ion Concentrations 1985-2003 1997
1997 1999 Nitrate Ion Concentrations 1985-2003 1998
1998 2000 Nitrate Ion Concentrations 1985-2003 1999
1999 2001 Nitrate Ion Concentrations 1985-2003 2000
2000 2002 Nitrate Ion Concentrations 1985-2003 2001
2001 2003 Nitrate Ion Concentrations 1985-2003 2002
2002 2004 Nitrate Ion Concentrations 1985-2003 2003
1984 1986 Nitrate Ion Concentrations 1985-2003 1985
2002 2004 Nitrate Ion Concentrations 1985-2003 2003
Percent change in NO3- in wetfall Lehmann et al., Environmental Pollution 2005
Downward pointing arrows denote trends toward decreasing nitrate (NO3) concentrations and improving air quality. Similarly, the up arrows correspond to trends toward higher nitrate concentrations and hence worsening air quality.