Download
1 / 7
70 likes | 74 Views
Use your Dynamics 365 to the best of its potential by visualizing customer data on geo-analytical maps with a drawing toolbar. Read more to learn howu2026

E N D
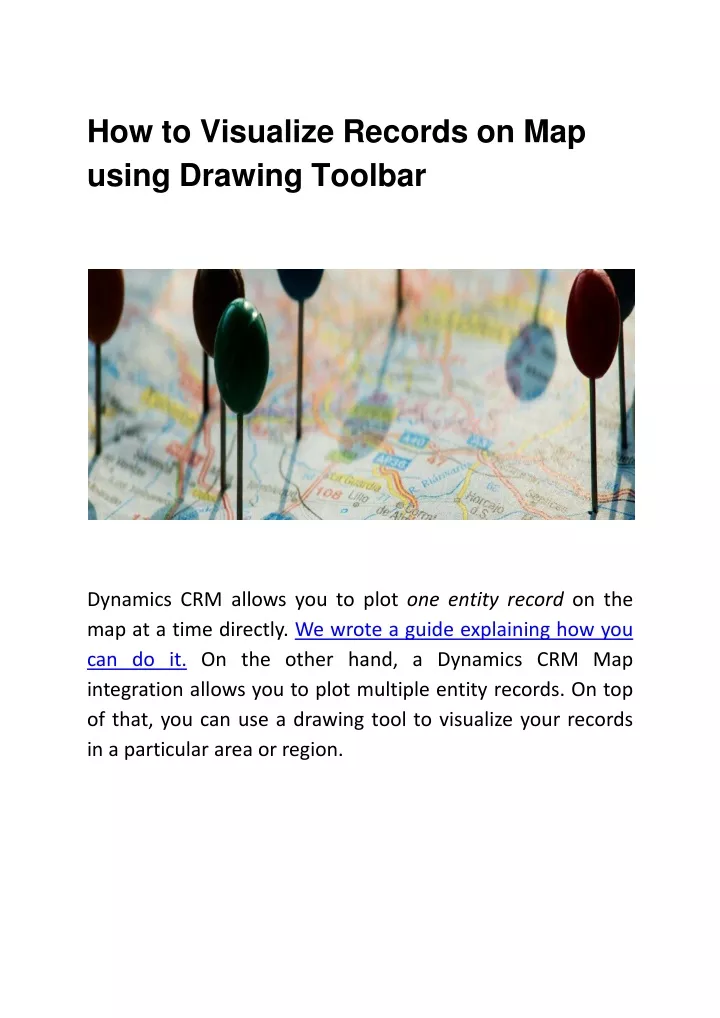
How to Visualize Records on Map using Drawing Toolbar Dynamics CRM allows you to plot one entity record on the map at a time directly. We wrote a guide explaining how you can do it. On the other hand, a Dynamics CRM Map integration allows you to plot multiple entity records. On top of that, you can use a drawing tool to visualize your records in a particular area orregion.
One such tool is QuickMaps. You can search data on Quick Maps based on Region, User, and there is even an option for Proximity Search. You can also search and manage records by defining shapes on the map. You can search records by drawing shapes on the map to get the geographical view and visualization of the records. Based on that you can perform your marketing/sales related actions andactivities. To visualize records in desired shapes on the map for selected entities follow the belowsteps: Step 1: Redirect to “Map”page Click on the Dynamics 365 menu and then click on the “Quick Maps” from the slider menu or find the “AppJetty” tab from the header menu and click on Maps to open QuickMaps.
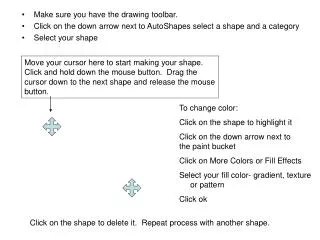
Step 2: Select the required entity and its view from the Select Entity option and select “Drawing” from Search Options. By selecting the Drawing option, the Drawing Toolbar with various tools will beenabled. • Step 3: Use ‘Drawing toolbar’ to draw the desired shape on Map • Youcanuse‘Drawingtoolbar’todrawtheshapefrom following availabletools: • Polygon: Draw a polygon of the desired size with multiple sides. • Circle: Draw a circle using thistool.
Rectangle: Draw a rectangle using thistool. • You can also edit the drawn shape and can change shape’s fill and border color using the following drawingtools: • Edit: Edit the drawn shape or resize the shape using this tool. • Erase: Erase drawn shape from the map using thistool. • Fill color: Define or change the fill color of shape using this tool. • Stroke color: Define or change the shape’s border color using thistool. • Step 4: Visualize data from the drawn shape on themap • You can draw multiple shapes on themap. • After drawing the shape, click on the “Search” button to visualize data from the drawn shape on the map. The data will be plotted on the drawingshape.
- By clicking on any shape it will display a summary card for selected shape and update data in the data gridaccordingly.
Getting the records on the map as per the drawn shape is also known as “User-Editable Shapes” as the user can draw, edit and remove the shape as per his/herrequirement. Drawing shapes feature in Dynamics CRM map integration will make it easy for you to visualize and check the records of the selected entities in a particular area of any city, state, and region. OriginalBlog: https://www.appjetty.com/blog/visualize-records-map-usi ng-drawing-toolbar