Download
1 / 50
510 likes | 614 Views
International Studies of Physical Activity & Built Environment James Sallis San Diego State University www.drjamessallis.sdsu.edu. Deaths attributed to 19 leading factors, by country income level, 2004. Why Environment & Physical Activity?.

E N D
International Studies of Physical Activity & Built EnvironmentJames SallisSan Diego State Universitywww.drjamessallis.sdsu.edu
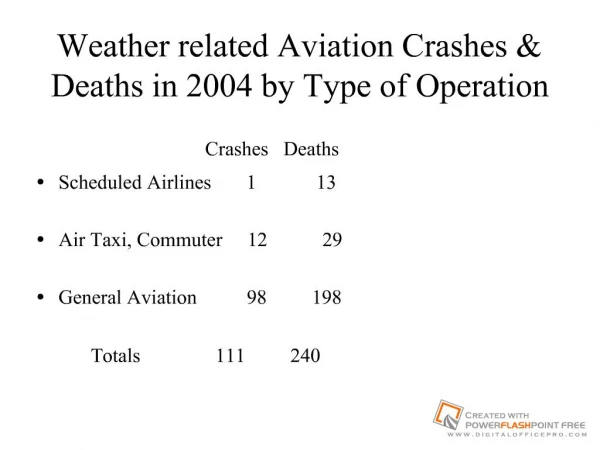
Deaths attributed to 19 leading factors,by country income level, 2004
Why Environment & Physical Activity? • Broad societal & technological developments are believed to be reducing PA in work, transport, & household settings • These developments are happening in all countries • Ecological models of behavior teach that policy & environmental factors have the broadest & longest-lasting impacts • Research on environment & policy aspects of PA is limited in all countries and absent in most
Need for Research on Environment + PA • WHO global strategy on diet and physical activity emphasizes environment & policy change • National PA plans call for environment & policy change • Country-specific research is needed to inform policy & planning decisions
Environments Differ!!!! Ghent, Belgium Atlanta, USA
Funded by NIH/NHLBI 2001-2005 www.nqls.org
Neighborhood Walkability and Income Are Related to Physical Activity & BMI James F. Sallis, Brian E. Saelens, Lawrence D. Frank, Donald J. Slymen, Terry L. Conway, Kelli Cain, & James C. Chapman. San Diego State University; University of Washington; University of British Columbia
Primary Aim • Investigate whether people who live in “walkable” communities are more active, after adjusting for SES, than people who live in less walkable communities. • This study was the methodological template for other studies so comparisons could be made
NQLS Neighborhood Categories Walkability High Low 4 per region 4 per region Low Socioeconomic Status High 4 per region 4 per region
GIS-Based Walkability Index • Net Residential Density • Intersection Density (intersections per acre) • Retail floor area ratio (FAR): ratio of retail building square footage to land area • Land Use Mix: evenness of mix across 4 types of uses. • Walkability = sum of z-scores of components • Calculated for census block groups to select N-hoods
Participant Selection & Recruitment • Adults aged 20-65 recruited from randomly selected households in target neighborhoods • Recruitment by mail & phone • 2100 available for analyses; 30% response rate • 48% female; 25% non-white
Key Measures • Actigraph accelerometer • Worn for up to 14 days • Outcome is mean daily minutes of MVPA • BMI, based on self-report height & weight • NEWS: Neighborhood Environment Walkability Scale
Accelerometer-based MVPA Min/day in Walkability-by-Income Quadrants Walkability: p =.0002 Income: p =.36 Walkability X Income: p =.57 * Adjusted for neighborhood clustering, gender, age, education, ethnicity, # motor vehicles/adult in household, site, marital status, number of people in household, and length of time at current address.
Percent Overweight or Obese (BMI>25) in Walkability-by-Income Quadrants Walkability: p =.007 Income: p =.081 Walkability X Income: p =.26 * Adjusted for neighborhood clustering, gender, age, education, ethnicity, # motor vehicles/adult in household, site, marital status, number of people in household, and length of time at current address.
PLACE StudyPhysical activityinLocalitiesAndCommunityEnvironments Neville Owen, Adrian Bauman, Graeme Hugo, James F Sallis, Eva Leslie, Jo Salmon, Ester Cerin,Tim ArmstrongNational Health and Medical Research Council of Australia, 2002–2004 Primary Aim:to investigate whether people who live in ‘walkable’ communities are more physically active, after adjusting for socio-economic status
“Walkable” density, street connectivity, and mixed land use
Walking for Transport and Recreation in Low- and High-Walkable Communities* *Preliminary Analyses: unadjusted for confounders
Differences in PA behaviour in Belgian adults living in ‘high walkable’ versus ‘low walkable’ neighbourhoods.Belgian Environmental Physical Activity Study (BEPAS) Delfien Van Dyck Ilse De Bourdeaudhuij Greet Cardon Benedicte Deforche Ghent University – BELGIUM Faculty of Medicine and Health Sciences Department of Movement and Sports Sciences Preventive Medicine, 2010
BEPAS: Accelerometer-based MVPA Min/day in Walkability-by-Income Quadrants Walkability: β(SE)= .095(.030) p <.001 Income: β(SE)= -.026(.029) p =0.18 Walkability X Income: β(SE)= -.014(.040) p =.36 Adjusted for neighborhood clustering, gender, age, education, working status
BEPAS: Transport Walking Min/week in Walkability-by-Income Quadrants Walkability: β(SE)= .746(.157)p <.001 Income: β(SE)= -.360 (.155)p <.05 Walkability X Income: β(SE)= .027(.220) p =.45 Adjusted for neighborhood clustering, gender, age, education, working status
BEPAS: Transport Cycling Min/week in Walkability-by-Income Quadrants Walkability: β(SE)= .447(.105) p <.001 Income: β(SE)= .029(.102)p =.39 Walkability X Income: β(SE)= -.051(.144) p =.36 Adjusted for neighborhood clustering, gender, age, education, working status
BEPAS: Percent Overweight or Obese (BMI>25) in Walkability-by-Income Quadrants Walkability: β(SE)= -.870(.182) p <.001 Income: β(SE)= -.197(.167) p =.12 Walkability X Income: β(SE)= .910(249) p <.001 Adjusted for neighborhood clustering, gender, age, education, working status
BEPAS: Conclusions Living in high walkable neighbourhoods: 80 min/week more walking for transport 40 min/week more cycling for transport 20 min/week more walking for recreation 35 min/week less motor transport 50 min/week more MVPA (accelerometer) Very similar to US results
Relationships between environmental attributes and walking for various purposes among Japanese adults Shigeru Inoue, MD, PhD Department of Preventive Medicine and Public Health Tokyo Medical University
Nakano area of Tokyo, Japan Shopping street Residential area
Methods Tsukuba Area: 284km2 Population: 208,985 Density: 736 /km2 Kagoshima 547km2 604,431 1,105 /km2 Koganei 11km2 113,433 10,312 /km2 Shizuoka 1,388km2 710,854 512 /km2 • Study design A Cross-sectional mail survey in four Japanese cities (Tsukuba, Koganei, Shizuoka and Kagoshima).
Summary of the results from NEWS • All environmental variables were related to specific types of walking behavior in expected direction. • Environmental variables related to walking for leisure and walking for daily errands were different • Relationship between walking and environment was especially strong in women’s walking for daily errands ○:Significant relationship
Built environment correlates of physical activity behaviours in a developing city: The case of Bogota, Colombia Olga Lucia Sarmiento and team Universidade de los Andes
Main Results Walking for transport (30 min/day for at least 5 days/week) was positively associated with: Street density (POR 1.71, 95% CI 1.19-2.46) Street connectivity (POR 2.21, 95% CI 1.40-3.49) Bus Rapid Transit stations in the neighborhood (POR 1.71, 95% CI 1.19-3.47) Biking for transport was positively associated with: Street density (POR 1.99, 95% CI 1.24-3.19) Leisure time physical activity (30 min/day for at least 5 days/week) was positively associated with: Park density (POR 2.05, 95%CI 1.13-3.72) Bus Rapid Transit stations in the neighbohood (POR 1.27, 95% CI 1.07-1.50)
Built Environments & Physical Activity: An 11-Country Study James F. Sallis, USA Heather Bowles, Australia Adrian Bauman, Australia Barbara E. Ainsworth, USA Fiona C. Bull, UK Michael Sjostrom, Sweden Cora Craig, Canada Et al. Am J Prev Med, 2009
Rationale • Each country has limited range of variation in built environment variables, so multi-country studies are needed to understand full impact of environments. • Most studies of environmental correlates of PA analyze each environment variable separately, so the cumulative effects are not clear. • Built environment survey measure was added to International PA Prevalence Study
PANES: Physical Activity Neighborhood Environment Survey • Perceived social & physical environment items adapted from published surveys (Kirtland, 2003; Saelens, 2003). • Standard methods of translation and cultural adaptation. • Reliability confirmed in Sweden, Nigeria, US • Attributes rated on 4-point scale, but dichotomized as “agree” vs “disagree”
Belgium, 1425 Brazil, 951 Canada, 856 Colombia, 2699 Hong Kong, 1225 Japan, 1001 Lithuania, 2099 New Zealand, 1298 Norway, 1131 Sweden, 998 United States, 4711 Sample Sizes by Country
Started at ICBM in Mainz Germany in 2004 by: Sallis & Kerr, US Owen, Australia DeBourdeaudhuij, BelgiumStudies in 3 countries indicated that a common study design and measures were feasible, so the goal was to apply methods to other countries, improving on IPS study
Why do we need the IPEN study? • National organizations and WHO recommend environment & policy changes to increase PA • Need international evidence • Full variability in environments requires research in multiple countries • If data are to be pooled, common measures & design are needed • More detailed measures will provide more specific policy guidance
Maximizing within and between country variance (illustration) HK Japan UK Belgium Czech Walking Sweden Columbia Aus BUT relationship between walking and walkability may not be linear NZ US Walkability
Main NCI Study Aims • IPEN study funded by NCI 2009—2013 • Main aims: 1. Support countries to collect or enhance data according to common protocol 2. Transfer data to central dataset 3. Study co-ordination, quality control, & pooled analyses 4. Support the network more widely 5. Advance science through pooled analyses 6. Use results to inform policy internationally
Australia Belgium Brazil Canada (2) Denmark Columbia Czech Republic Hong Kong Mexico Spain Sweden UK New Zealand USA IPEN participating countries (so far)
Policy relevance • If studies show stronger relationship between activity & environment, then policy makers more likely to support & fund environmental change • Examples from other countries with unique environments can inform built environment changes (without expensive experiments) • National data needed in each country to convince national policy makers
Conclusions • Environments Seem to • Matter Around the World • The international database • Is expanding rapidly • We need to use research to • Drive policy change • www.ipenproject.org