Download
1 / 122
1.23k likes | 1.48k Views
Economic Opportunity and Crime. Economics 160. Lecture 5 Professor Votey Crime Generation: Youth and Women. Notes :Votey, Lecture 3, 37. Consider the Circular Flow Process: (again). Depicting ( more elaborately) The Social Costs of Crime. This is the Social Cost Of Crime.

E N D
Economics 160 Lecture 5 Professor Votey Crime Generation: Youth and Women Notes:Votey, Lecture 3, 37
Consider the Circular Flow Process: (again) • Depicting ( more elaborately) The Social Costs of Crime This is the Social Cost Of Crime Victim Costs +
The Circular Flow Model in Symbolic Notation • Crime Generation:OF = g( CR, SV, SE) (1) • CR=Clearance Ratio • SV=Severity of Sentence • SE=Soc. & Econ. Conditions • Crime Control:(Lect. 3)CR = f( OF, L ) (2) • OF=Crime Load on the System • L =Law Enforcement Resources • Society’s ObjectiveMin. SC = r . OF + w . L (3) • where r = loss rate / Offense • w = resource price (police wage) • We might think of this as a social control model. • How does it relate to our notions of individual behavior? Note the circularity of the relationships Notes p. 37
Recall Jeremy Bentham’s Notion of Individual Utility Maximization
Recall Jeremy Bentham’s Notion of Individual Utility Maximization • The Individual will maximize:
Recall Jeremy Bentham’s Notion of Individual Utility Maximization • The Individual will maximize:E (NB ) = E ( B ) - E ( C ) = $B .P ( B ) - $C . P ( C )
Recall Jeremy Bentham’s Notion of Individual Utility Maximization • The Individual will maximize: E (NB ) = E ( B ) - E ( C ) = $B .P ( B ) - $C . P ( C )and will commit a crime
Recall Jeremy Bentham’s Notion of Individual Utility Maximization • The Individual will maximize:E (NB ) = E ( B ) - E ( C ) = $B .P ( B ) - $C . P ( C ) and will commit a crime if E ( NB ) > 0
Recall Jeremy Bentham’s Notion of Individual Utility Maximization • The Individual will maximize: E (NB ) = E ( B ) - E ( C ) = $B .P ( B ) - $C . P ( C ) and will commit a crime if E ( NB ) > 0 • Consider a potential criminal with two options:
Recall Jeremy Bentham’s Notion of Individual Utility Maximization • The Individual will maximize: E (NB ) = E ( B ) - E ( C ) = $B .P ( B ) - $C . P ( C ) and will commit a crime if E ( NB ) > 0 • Consider a potential criminal with two options:A Crime:E(NB(Crime))= $Take . P(Not Jail))-$Jail . P(Jail)where P(Not Jail) = 1 - P(Jail)
Recall Jeremy Bentham’s Notion of Individual Utility Maximization • The Individual will maximize: E (NB ) = E ( B ) - E ( C ) = $B .P ( B ) - $C . P ( C ) and will commit a crime if E ( NB ) > 0 • Consider a potential criminal with two options:A Crime:E(NB(Crime))= $Take . P(Not Jail))-$Jail . P(Jail) where Not Jail = 1 - P(Jail)An Honest Job:E(NB(Job)) = $wage . P(E)-$U . P(U)where E=Employed, U=Unempl, and P(E) = 1- P(U)
Recall Jeremy Bentham’s Notion of Individual Utility Maximization • The Individual will maximize: E (NB ) = E ( B ) - E ( C ) = $B .P ( B ) - $C . P ( C ) and will commit a crime if E ( NB ) > 0 • Consider a potential criminal with two options:A Crime:E(NB(Crime))= $Take . P(Not Jail))-$Jail . P(Jail) where Not Jail = 1 - P(Jail)An Honest Job:E(NB(Job)) = $wage . P(E)-$U . P(U) where E=Employed, U=Unempl, and P(E) = 1- P(U) • A Rational Individual will pick the Best Option
Note that Using Bentham’s Analysis suggests a two pronged set of policy alternatives Raise the Cost of Jail (length of sentence) and / or Increase P(Arrest), P(Conviction|Arrest), P(Jail|Conviction) thru Crime Control Social Choice thru Crime Generation Lower P(Being Unemployed) and / or Raise Wages
Two Views – or maybe three • The Rational Man Approach to Crime Control¹(Bentham’s Logic ) • Most Modern Criminologists 2(Rejecting Bentham) • The Liberal Rational Man3(Bentham’s Logic Extended) ¹ Deterrence Works – Use the threat of Punishment ² Deterrence Doesn’t Work –(Rely on the Imprisonment Model) ³ Deterrence Works, but so do Economic Opportunities (In Today’s World this might have been Bentham’s View)
Some Personal Questions in Regard to Career Choice
Some Personal Questions in Regard to Career Choice • Not for the record
At this point, we are – Back to Positive Economics • A little bit like detective work • A detective’s job is to solve a crimeso that the prosecutor can deal with the criminal • Our task was to explain criminal behavior • So that Public Policy could be modified|to reduce the likelihood of crime • The same sort of stimulus was facing Steven Levitt when he wrote his book
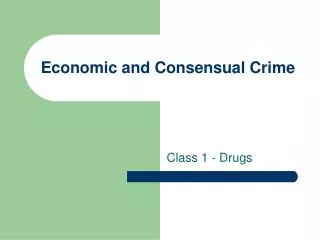
Consider Crimes Committed by Youth: We Note That: • Crime involvement greatest among youth
FBI, Uniform Crime Reports Cities of the U.S., By Type of Offense, By Age
Consider Crimes Committed by Youth: We Note That: • Crime involvement greatest among youth • Historically Crime has been predominantly a malephenomenon
Relatively few offenders are female % Females in group All arrests (adults and juveniles) 17% Index crime arrests 21 Violent crime arrests 11 Property crime arrests 24 Larceny 31 Non larceny 8 Report to the Nation, 2nd Edit., p. 46 (Incarceration Data from 1984)
Consider Crimes Committed by Youth: We Note That: • Crime involvement greatest among youth • Historically Crime has been predominantly a malephenomenon (I will talk further about women’s increasing involvement in crime.)
Consider Crimes Committed by Youth: We Note That: • Crime involvement greatest among youth • Historically Crime has been predominantly a malephenomenon • Crime is more prevalent in the cities
Who are the victims of violent crime? Rates per 1,000 persons age 12 and older____ Residence (1984) RobberyAssaultRape Central City 11 31 1 Suburban 5 24 1 Rural 3 19 1 Report to the Nation, 2nd Edit., p. 27
Consider Crimes Committed by Youth: We Note That: • Crime involvement greatest among youth • Historically Crime has been predominantly a malephenomenon. • Crime is more prevalent in the cities • Non-whites are more than proportionately involved
Consider Crimes Committed by Youth: We Note That: • Crime involvement greatest among youth • Historically Crime has been predominantly a malephenomenon. • Crime is more prevalent in the cities • Non-whites are more than proportionately involved • In our earliest analysis of youth participation in crime,we believed that a primary cause was lack of economic opportunities
Consider the picture of economic opportunities for youth • Youth unemployment rates are high relative to those of older workers.Unempl. Rate = Persons actively seeking work Labor Force
Consider the picture of economic opportunities for youth • Youth unemployment rates are high relative to those of older workers.Unempl. Rate = Persons actively seeking work Labor Force • What has been the effect of higher unemploymentrates for youth ?
Consider the picture of economic opportunities for youth • Youth unemployment rates are high relative to those of older workers.Unempl. Rate = Persons actively seeking work Labor Force • What has been the effect of higher unemploymentrates for youth ?1. A decline in their Labor Force Participation Rates Age Specific =No. Empl. or Seeking Work (Age) LFPR Population (Age)
Recall that, in my previous lecture I showed that a factor in the growth crime was a decline in police effectiveness starting in the mid-fifties. Here we see another factor that may be important, This is labor market data (BLS) The decline in the Labor Force Participation Rate This is something Philip Cook Didn’t Understand Notes p. 42
An Important Elaboration Here • Prof. Phillips showed video of Phil Cook, Duke Univ, saying unemployment didn’t have much to do with crime patterns. • There was something he didn’t understand.He wasn’t alone in not understanding the link between jobs and crime.
Consider the picture of economic opportunities for youth • Youth unemployment rates are high relative to those of older workers.Unempl. Rate = Persons actively seeking work Labor Force • What has been the effect of higher unemploymentrates for youth ?1. A decline in their Labor Force Participation Rates Age Specific =No. Empl. or Seeking Work (Age) LFPR Population (Age)2. Youth invest in schooling to get a better job, stay out of the labor force temporarily.
More Recent Data on the Labor Market and Schooling Measure Population Year___________________ ________Males, 18-19 1968 1979 1982 1984 1988 1998_2000UR % White 7.9 19.0 10.4 Non-white 12.3 29.6 25.0 LFPR% White 65.7 74.5 69.0 Non-white 63.3 57.8 43.8 School Combined 60.4 47.8 Enrollments ______,all ages UR Combined 3.6 5.8 11.0 7.5 7.04.4 4.0 LFPR “ 59.6 63.367.1 67.2Source: Employment and Training Report of the President, various issues; 2000 data, www.bls.gov
Testing the Hypothesis that Crime Rates for youth are related to economic opportunities The Population of 18-19 year olds This figure in Notes, p.38 AS IP Persons committing crimes EMPL NLF UNEM These relationships can be stated in terms of probabilities
AS IP EMPL NLF UNEM
Our Hypothesis: Crimes by youth are a function of lack of legitimate economic opportunities - as a probability statement: Notes, p.38 We start by simply describing the relationships illustrated in the Venn Diagram of Fig. 3.6 as a probability statement:
The Hypothesis: Crimes by youth are a function of lack of legitimate economic opportunities - as a probability statement: Notes, p.32 • We start by simply describing the relationships illustrated in the Venn Diagram of Fig. 3.6 as a probability statement: AS IP EMPL NLF UNEM
The Hypothesis: Crimes by youth are a function of lack of legitimate economic opportunities - as a probability statement: We start by simply describing the relationships illustrated in the Venn Diagram of Fig. 3.6 as a probability statement: P(Commit Crime) = P(Commit Crime and EMPL) + AS IP EMPL NLF UNEM
The Hypothesis: Crimes by youth are a function of lack of legitimate economic opportunities - as a probability statement: We start by simply describing the relationships illustrated in the Venn Diagram of Fig. 3.6 as a probability statement: P(Commit Crime) = P(Commit Crime and EMPL) + AS IP EMPL NLF UNEM
The Hypothesis: Crimes by youth are a function of lack of legitimate economic opportunities - as a probability statement: We start by simply describing the relationships illustrated in the Venn Diagram of Fig. 3.6 as a probability statement: P(Commit Crime) = P(Commit Crime and EMPL) + P(Commit Crime and UNEM) + AS IP EMPL NLF UNEM
The Hypothesis: Crimes by youth are a function of lack of legitimate economic opportunities - as a probability statement: We start by simply describing the relationships illustrated in the Venn Diagram of Fig. 3.6 as a probability statement: P(Commit Crime) = P(Commit Crime and EMPL) + P(Commit Crime and UNEM) + AS IP EMPL NLF UNEM
The Hypothesis: Crimes by youth are a function of lack of legitimate economic opportunities - as a probability statement: We start by simply describing the relationships illustrated in the Venn Diagram of Fig. 3.6 as a probability statement: P(Commit Crime) = P(Commit Crime and EMPL) + P(Commit Crime and UNEM) + P(Commit Crime and NLF) + P(other) AS IP EMPL NLF UNEM
The Hypothesis: Crimes by youth are a function of lack of legitimate economic opportunities - as a probability statement: We start by simply describing the relationships illustrated in the Venn Diagram of Fig. 3.6 as a probability statement: P(Commit Crime) = P(Commit Crime and EMPL) + P(Commit Crime and UNEM) + P(Commit Crime and NLF) + P(other) AS IP EMPL NLF UNEM
The Hypothesis: Crimes by youth are a function of lack of legitimate economic opportunities - as a probability statement: We start by simply describing the relationships illustrated in the Venn Diagram of Fig. 3.6 as a probability statement: P(Commit Crime) = P(Commit Crime and EMPL) + P(Commit Crime and UNEM) + P(Commit Crime and NLF) + P(other) AS IP EMPL NLF UNEM
The Hypothesis: Crimes by youth are a function of lack of legitimate economic opportunities - as a probability statement: We start by simply describing the relationships illustrated in the Venn Diagram of Fig. 3.6 as a probability statement: P(Commit Crime) = P(Commit Crime and EMPL) + P(Commit Crime and UNEM) + P(Commit Crime and NLF) + P(other) in terms of the components: