Download

1 / 33
330 likes | 469 Views
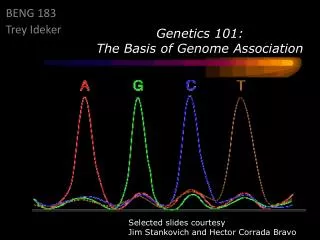
Pathway Association Analysis Trey Ideker UCSD. A working network map of the cell. Network evolutionary comparison / cross-species alignment to identify conserved modules. Network-based classification of cases vs. controls. The Working Map.

E N D
A working network map of the cell Network evolutionary comparison / cross-species alignment to identify conserved modules Network-based classification of cases vs. controls The Working Map Projection of molecular profiles on protein networks to reveal active modules Functional separation of gene families Integration of transcriptional interactions with causal or functional links Moving from genome-wide association studies (GWAS) to network-wide “pathway” association (PAS) Alignment of physical and genetic networks Building networks Using networks
Shannon et al. Genome Research 2003Cline et al. Nature Protocols 2007 www.cytoscape.org • OPEN SOURCE Java platform for integration of systems biology data • Layout and query of interaction networks (physical and genetic) • Visual and programmatic integration of molecular state data (attributes) • The ultimate goal is to provide the tools to facilitate all aspects of pathway assembly and annotation. • RECENT NEWS • Version 2.6 released June 2008; Scalability+efficiency now equivalent to best commercial packages • The Cytoscape Consortium is a 501(c)3 non-for-profit in the State of California • The Cytoscape ® Registered Trademark awarded • JOINTLY CODED with Agilent, ISB, UMich, Pasteur, Sloan-Ketter., UCSF, Unilever, Toronto
Comparison of biological networks (Silpa Suthram with Roded Sharan, Richard Karp, and others)
Cross-comparison of networks: • Conserved regions in the presence vs. absence of stimulus • Conserved regions across different species Suthram et al. Nature 2005 Sharan et al. RECOMB 2004 Kelley et al. PNAS 2003 Sharan & Ideker Nat. Biotech. 2006 Scott et al. RECOMB 2005 Ideker & Sharan Gen Res 2008
Plasmodium: a network apart? Plasmodium-specificprotein complexes Conserved Plasmodium / Saccharomyces protein complexes Suthram et al. Nature 2005La Count et al. Nature 2005
Synthetic lethals and epistatic interactions in model species Genetic Interactions: • Classical method used to map pathways in model species • Highly analogous tomulti-genic interaction in human disease and combination therapy • Thousands are being uncovered through systematic studies Adapted from Tong et al., Science 2001
Genetic and physicalinteractions are orthogonal Genetic Interactions Physical Interactions Kelley Nature Biotech. 2005
Functional maps of protein complexes Bandyopadhyay et al. PLoS Comp Bio 2008
Comparison of genetic interaction networks across budding and fission yeasts Positive Genetic Interactions Negative Genetic Interactions Assen Roguev,Sourav Bandyopadhyay,Nevan Krogan Roguev et al. Science322: 405 (2008)
Network-based approaches to identify genetic interactions in gene association studies
Genetic interactions occur frequently in Genome Wide Association Studies (GWAS) Marker – marker interactions But they are impossible to find. Marker-marker interactions are very difficult to identify in GWAS data due to lack of statistical power.
GWAS genetic interactions also run between physical networks and pathways Rohith Srivas & Greg Hannum Richard Karp & Nevan Krogan
GWAS interactions can be verified by inducing epistasis using classical genetics
Sponsors NIGMS NIEHSNIMH NSFPackard FoundationAgilentUnileverPfizer Collaborators (UCSD) Richard Kolodner Tom KippsDavid Perkins Steve Briggs Lorraine Pillus Jean Wang Collaborators(external) Nevan Krogan (UCSF) Richard Karp (UC Berkeley) Roded Sharan (Tel Aviv) Bas van Steensel (NKI) Sumit Chanda (Burnham) Howard Fox (Scripps) Curt Wittenberg (Scripps) Russ Finley (Wayne State) Doheon Lee (KAIST) Gary Bader (U Toronto) The Cytoscape Team
Querying biological networks for “Active Modules” Color network nodes (genes/proteins) with:Patient expression profileProtein statesPatient genotype (SNP state)Enzyme activityRNAi phenotype Interaction Database Dump, aka “Hairball” Active Modules Ideker et al. Bioinformatics (2002)
Projection of RNAi phenotypes onto a network of human-human & human-HIV protein interactions Sumit Chanda
Network modules associated with infection Konig et al. Cell. 2008
Using protein networks for diagnostics / classification Han Yu Chuang with Tom Kipps and Steve Briggs (UCSD) Eunjung Lee & Doheon Lee (KAIST)
Examples of “informative subnetworks” Chuang et al. Molecular Systems Biology 2007
Assembling a working network map Network evolutionary comparison / cross-species alignment to identify conserved modules Network-based classification of cases vs. controls The Working Map Projection of molecular profiles on protein networks to reveal active modules Functional separation of gene families Integration of transcriptional interactions with causal or functional links Moving from genome-wide association studies (GWAS) to network-wide “pathway” association (PAS) Alignment of physical and genetic networks Building networks Using networks
The dynamic genetic network induced by DNA damage 384 All pairwise deletions: KinasesPhosphatases Transcription Factors 1. Untreated conditions 2. 0.025% MMS 384 1536 45 Canonical DNA repair genes versus standard deletion library
− MMS + MMS
How in the world should we process these data ???? − MMS + MMS
One answer: Develop statistics to identify only the differences Red – Negative in MMS Green – Positive in MMS