Download
1 / 59
590 likes | 935 Views
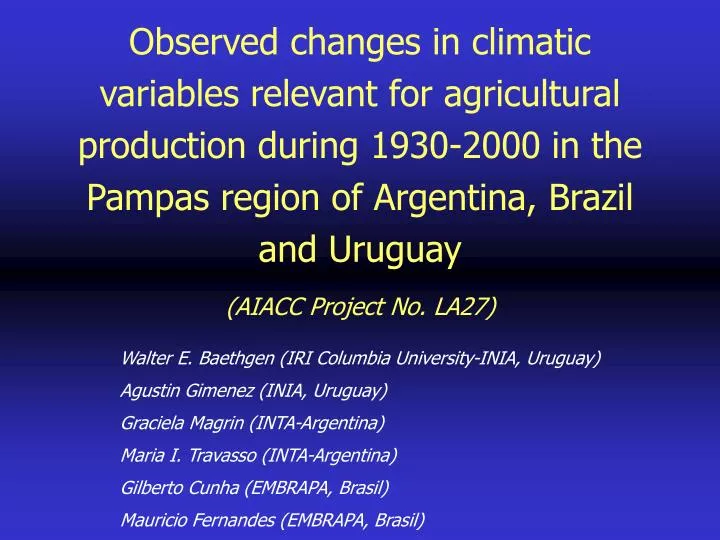
Observed changes in climatic variables relevant for agricultural production during 1930-2000 in the Pampas region of Argentina, Brazil and Uruguay (AIACC Project No. LA27). Walter E. Baethgen (IRI Columbia University-INIA, Uruguay) Agustin Gimenez (INIA, Uruguay)

E N D
Observed changes in climatic variables relevant for agricultural production during 1930-2000 in the Pampas region of Argentina, Brazil and Uruguay (AIACC Project No. LA27) Walter E. Baethgen (IRI Columbia University-INIA, Uruguay) Agustin Gimenez (INIA, Uruguay) Graciela Magrin (INTA-Argentina) Maria I. Travasso (INTA-Argentina) Gilberto Cunha (EMBRAPA, Brasil) Mauricio Fernandes (EMBRAPA, Brasil)
Objectives Explore changes in the last 70-100 years observed in climate variables that are relevant for agricultural production Establish the basis for one of the methods used in our project to create climate change scenarios: project changes observed in the last 70-100 years to the next 10-20 years using a weather generator (G. Magrin’s presentation)
Remaining Question: Were changes uniform throughout the entire period? Time Methods Linear regression of mean trimester rainfall and temperatures for the entire available period (1930 – 2000) Stat significance using parametric and non-parametric (Kendall) tests Plot slopes using a contouring and surface mapping program (Surfer) to study spatial distribution of changes Expected Result Annual mean changes of the trimester means for Rainfall, T Max, T Min in the entire period (1930 - 2000)
Methods (2) Compare rainfall and temperature means for different periods: 10-year periods: 1930-40, 1940-50, …, 1990-2000 20-year periods: 1930-50, 1940-60, …, 1980-2000 30-year periods: 1930-1960 vs 1970-2000
RESULTS Changes in Rainfall (mm Trimester / year) Linear regression Analysis
Changes in Rainfall (mm Trimester / year) Linear regression Analysis Significant Slopes (P<0.10)
Comparing two Periods: 1930-1960 vs 1970-2000
Changes in Temperatures Mean monthly T Max Mean monthly T Min Regression Analysis
T Min T Min MJJ JFM T Max T Max JJA JFM
Comparing two Periods: 1930-1960 vs 1970-2000
T Max: 1931-1960 vs 1970-2000 (Summer 1931-1960)
T Max: 1931-1960 vs 1970-2000 (Summer 1970-2000)
T Min: 1931-1960 vs 1970-2000 (Winter 1931-1960)
T Min: 1931-1960 vs 1970-2000 (Winter 1970-2000)
T Min: 1931-1960 vs 1970-2000 (Summer 1931-1960)
T Min: 1931-1960 vs 1970-2000 (Summer 1970-2000)
Relevance for Agricultural Production: Frost Regime
UY = Estanzuela AR = Pergamino
Changes in frost regime estimated with regressions (1930-2000)