Download
1 / 24
240 likes | 437 Views
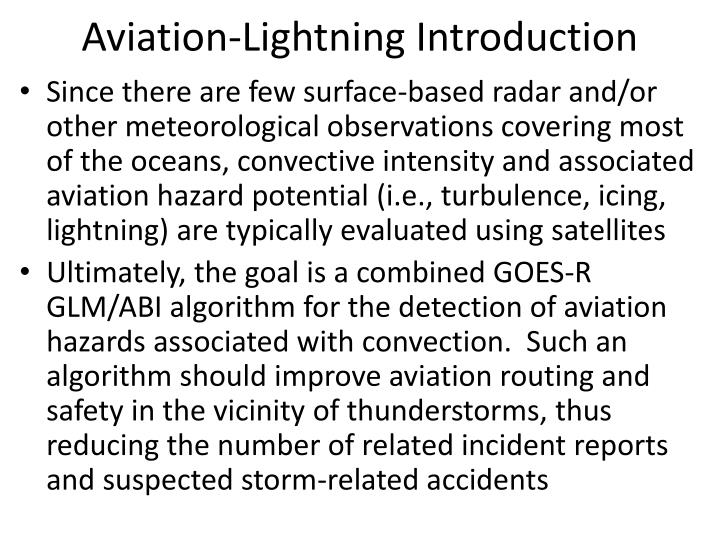
Aviation-Lightning Introduction. Since there are few surface-based radar and/or other meteorological observations covering most of the oceans, convective intensity and associated aviation hazard potential (i.e., turbulence, icing, lightning) are typically evaluated using satellites

E N D
Aviation-Lightning Introduction • Since there are few surface-based radar and/or other meteorological observations covering most of the oceans, convective intensity and associated aviation hazard potential (i.e., turbulence, icing, lightning) are typically evaluated using satellites • Ultimately, the goal is a combined GOES-R GLM/ABI algorithm for the detection of aviation hazards associated with convection. Such an algorithm should improve aviation routing and safety in the vicinity of thunderstorms, thus reducing the number of related incident reports and suspected storm-related accidents
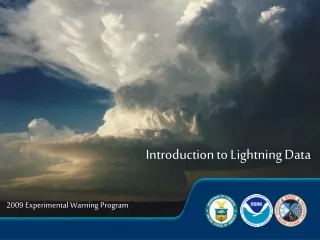
Introduction / Motivation • The objective of this study is to improve our understanding of the relationships between infrared (IR) and total lightning proxies of convective intensity and hazard potential • Employ low-earth orbit satellite observations from the Visible and Infrared Scanner (VIRS) and Lightning Imaging Sensor (LIS) instruments, respectively, aboard the NASA Tropical Rainfall Measuring Mission (TRMM)
Methodology • Integrate VIRS data into a new cell database (Leroy and Petersen, 2010), which currently utilizes TRMM Microwave Imager (TMI), Precipitation Radar (PR), and LIS data • Find overshooting tops (OTs) – a domelike protrusion above a cumulonimbus anvil, representing the intrusion of an updraft through its equilibrium level” (AMS Glossary of Meteorology) – for cells based on the VIRS data • Calculate OT area, OT ΔTB (mean surrounding anvil TB – OT center TB); lightning flash rate and density; and whether a cell has only lightning, only an OT, both, or neither
Methodology • Utilize satellite-based OT detection algorithm defined by Bedka et al (2010) that uses IR window channel brightness temperature gradients • Find candidate OT center pixels: • Find all “cold” pixels: those with VIRS TB ≤ 215K and colder than the Tropopause TB • Calculate mean surrounding anvil temperature • Use only “cold” pixels that are >15km from a colder pixel • Sample 16 pixels at 4-pixel radius from candidate OT center pixel • If at least 5 of the 16 pixels have a TB ≤ 225K, calculate average of these pixels • If a candidate OT center pixel has a TB at least 6.5K colder than the mean surrounding anvil temperature, then it is considered an OT center
Summary: VIRS/LIS • Incorporated VIRS TB data into cell database and used Bedka et al (2010) OT detection algorithm to detect OTs in VIRS data • For January 2006, almost all detected cells have neither lightning or OT. In all others, the occurrence of lightning is greater than OT occurrence. • Future Work: VIRS/LIS • Process data for at least 3 of the 5 years of the cell database • Incorporate PR data and look at approximate heights of the 20-40dBZ levels as another intensity proxy to compare to OT and lightning occurrence • Incorporate TMI data and look at ice/graupel content within a cloud as another intensity proxy since ice/graupel interactions are integral to lightning production
Integrated GOES-R GLM/ABI approaches for the detection and forecasting of convectively induced turbulenceLarry Carey (UAH), Wayne Feltz (UW CIMSS), Kris Bedka (NASA LaRC), and Walt Petersen (NASA MSFC) • Investigate the potential for satellite detection and short-term forecasting of turbulence and other aviation hazards associated with rapidly growing and mature convective cells. • Utilize integrated Geostationary Lightning Mapper (GLM) and Advanced Baseline Imager (ABI) proxy cloud top cooling, overshooting-top (OT)/enhanced-V, and total lightning flash rates and densities. • leverages available land-based total lightning networks and associated trending work to examine total lightning properties during turbulence encounters over Alabama, Washington DC, Oklahoma, and Florida Lightning Mapping Array (LMA) domains. • Turbulence occurrence will be mined using eddy dissipation rate (EDR) data from the NCAR turbulence algorithm applied to commercial aircraft navigation data (United, Delta and Southwest Airlines).
Rapidly developing convection is a known source of serious in-flight hazard. • Satellite derived cloud top cooling rate, OT and lightning flash rate trends are strong inferences of convective updraft intensity and growth rate. • However, relationships between lightning properties, OTs, infrared (IR) cooling rates and turbulence events have not been fully explored for diagnosis of turbulence or other enroute aviation hazards. • So, we propose to investigate the co-evolution of tracked total lightning and IR derived properties near convectively induced turbulence (CIT) using objective EDR reports. • enhanced knowledge may allow for the detection and forecasting of CIT over oceans and mountains thereby identifying likely hazardous and non-hazardous areas along data sparse flight routes. • Other GLM proxy measurements (satellite and ground-based) will be used to validate and understand results derived from LMA based research and to expand the realm of study to other locations without an LMA. • utilize ancillary measurements when available such as polarimetric radar data • Field campaigns (MC3E, CHUVA, DC3…)
What about case studies and testing over oceans (or other remote regions)?For temporal evolution, require GLM proxy (total lightning or as close as we can get).How close can we get?
GLD-360 ‘Validation’: GLM proxy over remote regions • Within the lightning science and applications community (including GLM R3), there is a need for lightning data over the oceans and other remote regions (i.e., global). • E.g., enroute aviation applications, hurricane studies, GLM proxy • LIS (OTD) is an ideal proxy for GLM but there is no temporal continuity (snapshots). • What are the potential options for global (or very large remote region)? • World Wide Lightning Location Network (WWLLN) • Vaisala Global Lightning Dataset (GLD360) • Other ground-based VLF-based long-range networks • WWLLN is more mature and better characterized • 30% cloud-to-ground (CG) flash detection efficiency (DE) for peak current > 30 kA • CG Flash Location Accuracy (LA) ~ 15 – 30 km
Vaisala’s GLD360 was launched in September 2009 • Sensors are strategically placed around the world for global coverage • Wideband sensors detect primarily (but not exclusively) CG lightning using magnetic direction finding (MDF) and time-of-arrival (TOA) methodologies combined with proprietary lightning recognition algorithms in the VLF (Very Low Frequency). • Vaisala conducted an in-house validation of GLD360 using Vaisala’s NLDN (National Lightning Detection Network) as ground-truth over CONUS. • 1 month in April-May 2009 • Assumptions about stroke-to-flash multiplicity, use of GLD360 peak current threshold calibrated to NLDN for discrimination of cloud strokes, NLDN CG strokes represent total population of CG strokes • Stroke matching method for determination of DE and LA: GLD360 CG stroke had to be within 200 µs and 60 km of an NLDN CG stroke • Results: 70% CG flash DE (29% CG stroke DE) 5-10 km median CG stroke LA
More recent studies utilize similar methods to validate GLD360 against NLDN over CONUS (Demetriades et al. 2010) and BrasilDAT over Brazil (Naccarato et al. 2010) • Used the same 22 days in December 2009 and January 2010 • CG Flash DE: Identify any GLD360 stroke that matches a NLDN (or BrasilDAT) CG flash (within 1 second and 30 km). GLD360 flash DE is then calculated by dividing number of matched NLDN (or BrasilDAT) CG flashes to the total number of NLDN (or BrasilDAT) CG flashes in the domain. • CG Flash LA: Identify any GLD360 stroke that matches a NLDN (BrasilDAT) CG stroke (within 200 µs and 60 km). Location error for GLD360 is assumed to be the position difference between NLDN (BrasilDAT) and GLD360 for matched strokes. • Demetriades et al. (2010) found GLD360 CG flash DE of 86% to 92% throughout the day and a median CG location accuracy of 10.8 km. • Naccarato et al. (2010) found GLD360 CG flash DE of 16% (3% to 40% by day) and a median CG location accuracy of 12.5 km.
Large differences in CG flash DE estimates over CONUS and Brazil using same methodology and days are curious • Differences could very well be a reflection of real spatial variation of GLD360 CG DE performance over the globe. • However, differences in “truth” CG lightning networks (NLDN and BrasilDat) – sensor types, performance, and data processing methodologies could also be convolved into these estimates. • Possible difficulties with and differences in methodology for differentiating IC from CG strokes in LF-VLF networks (say between NLDN and BrasilDat) is a potential source of error in such comparisons (e.g., potential for apples-to-oranges problem). • Neither Demetriades et al. (2010) nor Naccarato et al. (2010) mention any way of differentiating IC from CG strokes in GLD360 data before matching with NLDN or BrasilDat CG flashes/strokes, respectively. • All GLD360 strokes (including potential GLD360 IC strokes) that “match” NLDN/BrasilDat “CG” flashes (strokes) are included in “CG” DE (LA) estimation. • Difficult to account for; requires some assumptions. • Any spatial variation in GLD360 IC DE (e.g., say from sensor density) could possibly affect their estimated “CG DE”. • Probably a bigger (smaller) potential issue in high (low) stroke rate storms.
Approach? • Up for discussion and different investigators will approach differently, which is a good thing. • Some suggestions and thoughts: • Consider inter-comparing a variety of lightning networks • NLDN, GLD360, WeatherBug Total Lightning Network [WTLN], WWLLN etc • Consider a variety of temporal and spatial scales • Annual, seasonal, monthly, daily, storm, and cell temporal scales with appropriately matched spatial scales. • Try grid/cell/storm integration with and without flash-by-flash matching. • Ponder meaning of “IC”, “CG” and “total” lightning in these various LF, LF/VLF, and VLF networks. Could complicate inter-comparisons. • From a GLM proxy standpoint, we want “total” lightning. From that perspective, it seems appropriate to use all data provided by a network with little or no filtering. • If CG vs. IC differentiation can be done well in LF/VLF networks, then it may be highly desirable to do so in order to get a reasonable apples-to-apples comparison. • NSSTC has received about 3 months (16 Aug – 16 Nov 2010) of GLD360 data over a large region. Also have NLDNand WTLN. Millisecond timing so stroke matching not possible. • Preliminary results: started by looking at gridded (0.5 deg x 0.5 deg) GLD360, NLDN and WTLN stroke counts from 59 overlapping days with no IC vs CG distinction or matching of any kind.
* Overlap days: 8/17/2010, 8/24/2010 – 9/15/2010, 9/21/2010 – 10/5/2010, 10/12/2010 – 10/31/2010
* Overlap days: 8/17/2010, 8/24/2010 – 9/15/2010, 9/21/2010 – 10/5/2010, 10/12/2010 – 10/31/2010
* Overlap days: 8/17/2010, 8/24/2010 – 9/15/2010, 9/21/2010 – 10/5/2010, 10/12/2010 – 10/31/2010
* Overlap days: 8/17/2010, 8/24/2010 – 9/15/2010, 9/21/2010 – 10/5/2010, 10/12/2010 – 10/31/2010
* Overlap days: 8/17/2010, 8/24/2010 – 9/15/2010, 9/21/2010 – 10/5/2010, 10/12/2010 – 10/31/2010
* Overlap days: 8/17/2010, 8/24/2010 – 9/15/2010, 9/21/2010 – 10/5/2010, 10/12/2010 – 10/31/2010