Download
1 / 16
160 likes | 293 Views
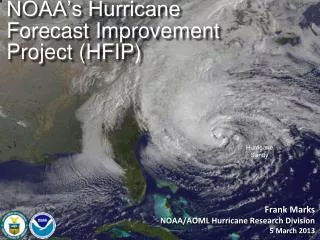
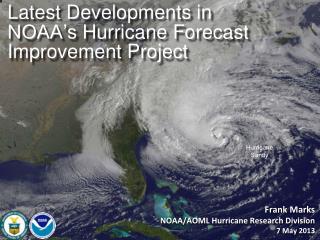
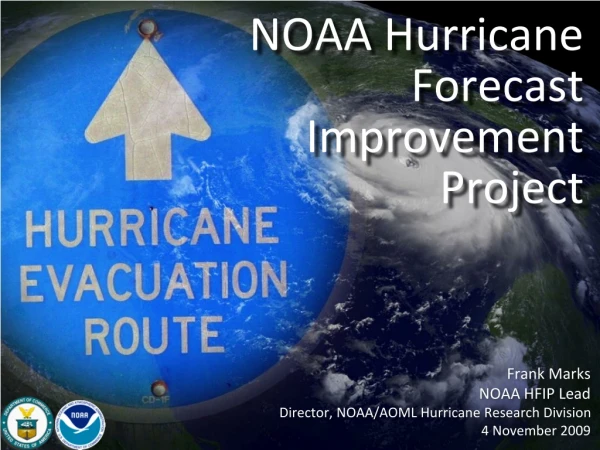
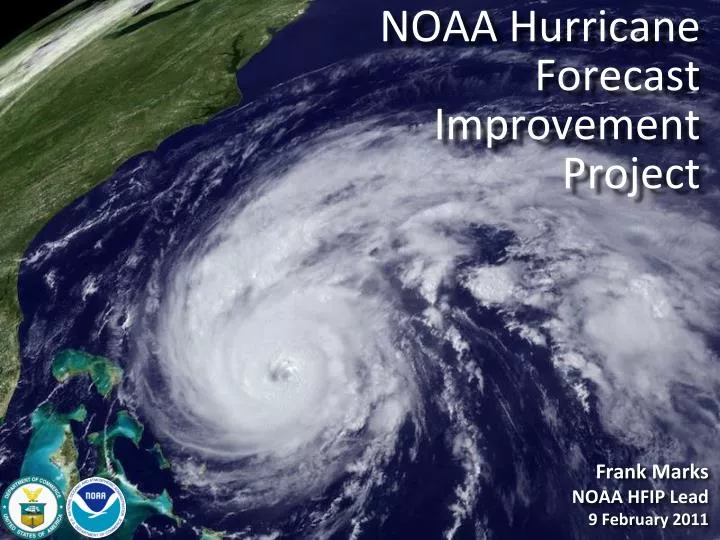
NOAA Hurricane Forecast Improvement Project. Frank Marks NOAA HFIP Lead 9 February 2011. The Good – track forecast improvements. Current Capabilities. The Bad - Intensity no real gains. No progress with intensity in last 15-20 years. Errors cut in half over past 15 years

E N D
NOAA Hurricane Forecast Improvement Project Frank Marks NOAA HFIP Lead 9 February 2011
The Good – track forecast improvements Current Capabilities The Bad - Intensity no real gains No progress with intensity in last 15-20 years • Errors cut in half over past 15 years • 10-year improvement - As accurate at 48 hours as we were at 24 hours in 1999 • 24-48h intensity forecast off by1category • Off by2categories perhaps 5-10% of time
Improvements still needed! Galveston–Ike 2008 • Risk to life and property continues to escalate in coastal regions • Population continues to increase – 50% of US population now live within 50 miles of coast. • Value of coastal infrastructure and economic activity continues to rise – estimated at over $3Trillion • More accurate hurricane forecasts and warnings can reduce response and recovery costs • More accurate forecast fewer false alarms, reduced warning footprint Bolivar Peninsula after Ike 2008
Goals • Improve Forecast Accuracy • Hurricane impact areas (track) – 50% in 10 years • Severity (intensity) – 50% in 10 years • Storm surge impact locations and severity • Extend forecast reliability out to 7 days • Quantify, bound and reduce forecast uncertainty to enable risk management decisions
How to get there? • Science (8 Teams) • Improved understanding from combination of observations & models • Higher resolution coupled models – critical to storm evolution forecasts – especially intensity changes • Forecast techniques to understand, reduce &communicate uncertainty • Information Technology • Increased computing power - run advanced hurricane/global models and reduce uncertainty • IT infrastructure for inter-agency data exchange • Observing Strategy • Improved use of existing and planned systems • Improved Products for Forecasters
HFIP Activities • Traditional Hurricane Research Activities: • Observations, analysis, database, & instrument R&D (IFEX) • Statistical-dynamical model development • Advances in operational models (Stream 1) • New HFIP Research Thrusts: • Experimental global and regional hurricane model development (Stream 2) - Gopal • Data assimilation techniques and observing system strategy analysis development (Stream 1 & 2) - Tomi • Model evaluation tool development • Socioeconomic research and development D1 D2 Partnership: NCEP, AOC, AOML, ESRL, GFDL, DTC, USWRP, NESDIS/STAR
Improved Use of Observations:Intensity Forecast experiment (IFEX 2010) • In-situ • Wind, press., temp. • Expendables • Dropsondes • AXBT, AXCP, buoy • Remote Sensors • Doppler Radar • SFMR/HIRAD • WSRA • Scatterometer/profiler • UAS Global Hawk UAS G-IV Tail Doppler Radar ONR DWL Rob Rogers, AOML/HRD
Improved Use of Observations:HFIP 2010 Demo: Earl 11 P-3 Flights 28 August – 3 September 2010 • 5 missions at 12-h intervals • 00Z 28 – 12Z 30 August, 6 missions at 12-h intervals 00Z 1 September – 00Z 3 September collecting Doppler SO (HEDAS) HWRFx/HEDAS 20100831 00UTC Doppler SO (EnKF) transmitted in real-time to HRD for assimilation into HWRFx model 20100830I1 2126-0229 UTC HWRFx/HEDAS 20100831 00UTC J. Gamache, A. Aksoy, T. Vukicevic, Gopal (AOML/HRD)
RTMM GH-DC8 Coordination (top) and HAMSR imagery overlaid on satellite images (bottom) Improved Use of Observations: Global Hawk UAS flight into Hurricane Earl Successes from Earl Flight 24 h mission (8 h on station) Ability to overfly a major hurricane (7 overpasses of eye) Mission scientists able to work with GH pilots on real time track changes Coordination with other aircraft possible and effective (3 passes with DC-8) All instruments worked well* and most provided real-time data and/or imagery *GPS dropsonde system not installed M. Black (AOML/HRD) & G. Heymsfield (NASA/GSFC)
Improved Models & Data:Model evaluation • Critical to HFIP success: Massive amounts of simulation output: • High-resolution hurricane (HRH) test: 69 cases (2005 & 2007) for 6 model teams - >50 Tb • 2008 – 2010 HFIP Real-time tests - >200 cases plus multi-model regional ensembles - >200 Tb • Need diagnostic tools to evaluate more than track and peak wind (e.g., large-scale, vortex-scale, convective scale, probability) Application Development & Diagnostics Team
Improved Models & Data:Model evaluation: Vortex-scale Tangential wind (m/s) 9-km HWRFx 3-km HWRFx normalized radius R*=R/RMW Vertical wind (m/s) 9-km HWRFx 3-km HWRFx normalized radius R. Rogers, J. Zhang, P. Reasor, & S. Lorsolo (AOML/HRD)
Improved Models & Data:Model evaluation: Convective-scale Observed AQUA 37/89 GHz closest time within 1 h 3h synthetic 37/85 GHz forecast from HEDAS IC • Use Model (HWRFV3.2) & DA (HEDAS) system to evaluate observing strategies in TC environments • Microwave satellite imagery (37- & 85-GHz) Forecast initial time 12Z, 08/29/2010 TomiVukicevic(AOML/HRD)
Conclusions from 2010 Experiments • Can reach HFIP track goals out to at least 5 days using current global models initialized with EnKF • Will need to be run at higher than current resolution to ensure continued gains • Radar data appears to be critical in initializing regional models (may require ENKF to use effectively) • May solve intensity problem for storms effecting U.S. • Need increased use of satellite data for storms further away • Statistical post processing provides a several percentage point improvement over raw scores (Bias Correction, Correlation Based Correction, other)
HFIP Science Priorities • Advancement in DA techniques for hurricane NWP • Physics Advancements • Microphysical processes • Air-sea processes and BL processes • R&D for determining optimal resolution and complexity of coupling • Advanced model diagnostic techniques (more than 3 numbers) • Analyses and forecast of large-scale and hurricane environment evolution • Identification and analyses of sources of model errors • Development of high resolution ensembles (global & regional) • Identify resolution and optimality of number of ensemble members • Improve intensity guidance • Techniques to maximize the usefulness of observations (OSE/OSSE)
Keys to Success • Partnership: AOML, ESRL, GFDL, DTC, USWRP, NESDIS/STAR working closely with Operations (EMC, NHC, AOC) and Federal & Academic Partners (NASA, NSF, ONR, NRL, NCAR, BOEMRS) • More integrated use & support of Testbeds: JHT, DTC, JCSDA • Blend Traditional hurricane research activities and HFIP research activities • Manpower (diversity) to evaluate model performance with hurricane data sets is a critical need IFEX/PREDICT/GRIP CBLAST IFEX/RAINEX DOTSTAR IFEX/TCSP