Download
1 / 32
360 likes | 822 Views
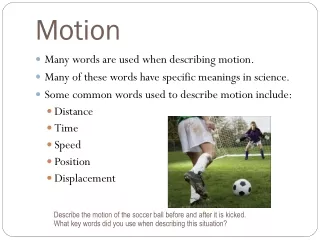
Motion. Change in position against some stationary background (frame of reference). Speed. Describes how fast an object moves Constant Speed – covers equal distance in equal amounts of time distance/time graph can be used to determine speed

E N D
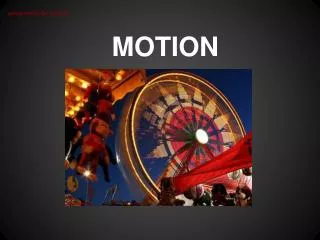
Motion Change in position against some stationary background (frame of reference).
Speed • Describes how fast an object moves • Constant Speed – covers equal distance in equal amounts of time • distance/time graph can be used to determine speed • distance/time graph is a straight line
Slope Formula m = y2 – y1 x2 – x1 Speed • Constant Speed (continued) • calculate slope to get speed
Speed • Constant Speed (continued) • the steeper the slope, the faster the speed of the object
Speed • Constant Speed (continued) • objects at rest, graph a flat line (slope = 0)
Speed • Average Speed – the distance covered by an object divided by the time it takes to travel it
Speed = distance v = d time t t = d v Speed Speed Equation d = vt
Speed Increasing the average speed increases the slope of the graph and the journey time is shortened.
Speed Reducing the average speed reduces the slope of the graph and lengthens the journey time.
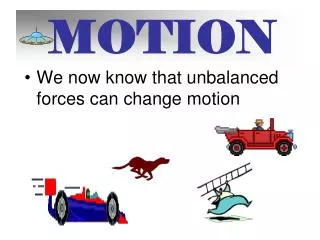
Acceleration Any change in velocity divided by the time during which the change occurred. Metric Units for Acceleration m/sec/sec OR m/sec2 Also: km/hr2 ft/sec2
a = rv OR a = vf - vi t t t = vf - vi a Acceleration Acceleration = change in velocity over time vf = final velocity & vi = initial velocity You can solve for t, vf, or vi: vf = at +vi vi =vf – (at)
a = rv OR a = vf - vi t t Acceleration Acceleration = change in velocity over time
Acceleration • If there is an increase in velocity, acceleration is positive • If there is a decrease in velocity, acceleration is negative (deceleration)
Acceleration • Making a turn or going around a curve is acceleration, even if the speed stays the same, because the direction of velocity changes (acceleration is any change in velocity—speed OR direction)
Distance (m) Distance (m) Time (sec) Time (sec) Speeding Up Slowing Down Acceleration Distance – Time Graphs for Acceleration
Velocity (m/sec) Velocity (m/sec) Time (sec) Time (sec) Constant Acceleration (positive slope = speeding up) Constant Deceleration (negative slope = slowing down) Acceleration Velocity – Time Graphs for Acceleration
Motion Graphs – Summary and Review • Describing the motion of an object is occasionally hard to do with words. Sometimes graphs help make motion easier to picture, and therefore understand. • Remember: • Motion is a change in position measured by distance and time. • Speed tells us the rate at which an object moves. • Velocity tells the speed and direction of a moving object. • Acceleration tells us the rate of speed or direction changes.
Motion Graphs – Summary and Review DISTANCE–TIME GRAPHS Plotting distance against time can tell you a lot about motion. Let’s look at the axes. Time is always plotted on the X-axis (bottom of the graph). The further to the right of the axis, the longer the time from the start. Distance is plotted on the Y-axis (side of the graph). The higher up the graph, the further from the start. Time is increasing to the right, but its distance does not change. It is not moving. We say it is At Rest.
Motion Graphs – Summary and Review DISTANCE–TIME GRAPHS If an object is moving at a constant speed, it means it has the same increase in distance in a given time. Time is increasing to the right, and distance is increasing constantly with time. The object moves at a constant speed. Constant speed is shown by straight lines on a graph.
Motion Graphs – Summary and Review DISTANCE–TIME GRAPHS Let’s look at two moving objects. Both of the lines in the graph show that each object moved the same distance, but the steeper dashed line got there before the other one. A steeper line indicates a larger distance moved in a given time. In other words, higher speed. Both lines are straight, so both speeds are constant. Graphs that show acceleration look different from those that show constant speed. The line on this graph is curving upwards. This shows an increase in speed, since the line is getting steeper: In other words, in a given time, the distance the object moves is changing (getting larger). It is accelerating.
Summary • The steeper the graph, the faster the motion • A horizontal line means the object is not changing its position—it is not moving, but is at rest • A downward sloping line means the object is return- ing to the start
Examine the graphs below. Which of the graphs shows that one of the runners started 10 yards further ahead of the other? Explain your answer.
Examine the graphs below. In which of the graphs are both runners moving at the same speed? Explain your answer.
The distance-time graphs below represent the motion of a car. Match the descriptions with the graphs. Explain your answers. • Description: • The car is stopped. • The car is traveling at a constant speed. • The speed of the car is decreasing. • The car is coming back. Graph A matches description _____ because __________________________. Graph B matches description _____ because __________________________. Graph C matches description _____ because __________________________. Graph D matches description _____ because __________________________.
Motion Graphs – Summary and Review SPEED-TIME GRAPHS Speed-Time graphs are also called Velocity-Time graphs. Speed-Time graphs look much like Distance-Time graphs. Be sure to read the labels! Time is plotted on the X-axis. Speed or velocity is plotted on the Y-axis. A straight horizontal line on a speed-time graph means that speed is constant. It is not changing over time. A straight line does NOT mean that the object is not moving!
Motion Graphs – Summary and Review SPEED-TIME GRAPHS This graph shows increasing speed. The moving object is accelerating. This graph shows decreasing speed. This moving object is decelerating.
Motion Graphs – Summary and Review SPEED-TIME GRAPHS What about comparing two moving objects at the same time? Both the dashed and solid lines show increasing speed. Both lines reach the same top speed, but the solid on takes longer. The dashed line shows greater acceleration.
Summary • A speed-time graph shows us how the speed of a moving object changes with time. • The steeper the graph, the greater the acceleration. • A horizontal line means the object is moving at a constant speed. • A downward sloping line means the object is slowing down.
The speed-time graphs below represent the motion of a car. Match the descriptions with the graphs. Explain your answers. • Description: • The car is stopped. • The car is traveling at a constant speed. • The car is accelerating. • The car is slowing down. Graph E matches description _____ because __________________________. Graph F matches description _____ because __________________________. Graph G matches description _____ because __________________________. Graph H matches description _____ because __________________________.
The graph above shows three runners who ran a 100-meter race. Questions • Which runner won the race? Explain your answer. • Which runner stopped for a rest? Explain your answer. • How long was the stop? Explain your answer. • How long did Bob take to complete the race? Explain your answer. • Calculate Albert’s average speed. (Figure the distance and time first!)
The graph below shows how the speed of a bus changes during part of a journey. Questions • Choose the correct words from the following list to describe the motion during each segment of the journey to fill in the blanks: • Accelerating • Decelerating • Constant speed • At rest Segment O-A: The bus is _____. Its speed changes from 0 to 10 m/s in 5 seconds. Segment A-B: The bus is moving at a _____ of 10 m/s for 5 seconds. Segment B-C: The bus is _____. It is slowing down from 10 m/s to rest in 3 seconds. Segment C-D: The bus is _____. It has stopped. Segment D-E: The bus is _____. It is gradually increasing speed.