Download
1 / 44
440 likes | 545 Views
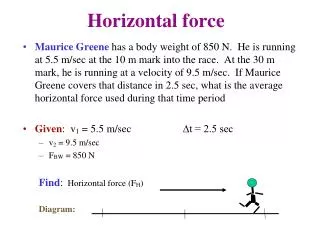
Horizontal Convective Rolls. Asai papers & Simulations w/ ARPS. Asai (1970a). Effect of vertical shear on roll orientation Boussinesq derivation - equations similar to shear instability derivation Negative Richardson numbers (reported as positive numbers) represent unstable environments

E N D
Horizontal Convective Rolls Asai papers & Simulations w/ ARPS
Asai (1970a) • Effect of vertical shear on roll orientation • Boussinesq derivation - equations similar to shear instability derivation • Negative Richardson numbers (reported as positive numbers) represent unstable environments • Presumed solutions similar to before, but solved numerically • Figure 2 • Most unstable mode is stationary relative to flow and becomes smaller in size as -Ri increases
Asai (1970a) Fig. 2 • -Ri vs. k (thermal instability increases upward; wavelength increases to left) • Left of dotted curve represents waves (rolls) stationary with respect to flow; propagating rolls to right • Wavelength of most unstable mode (fastest growing solution that will dominate) becomes smaller as environment becomes more unstable • Most unstable solution is stationary with respect to flow for all unstable environmental conditions
Asai (1970a) Fig. 8 • Consider roll wavelengths Lx and Ly. Rolls aligned along x-axis have Lx >> Ly. • Consider vertical shear oriented along the x-axis • Horizontal axis is ky/kx = Lx/Ly representing roll orientation • Large Lx/Ly means rolls parallel with the vertical shear vector (longitudinal rolls). Small Lx/Ly means rolls oriented perpendicular to shear (transverse rolls) • Vertical axis (labeled at right) is amplification rate for various roll orientations More…
Asai (1970a) Fig. 8 (continued) • Amplification rate vs. roll orientation for various values of -Ri (thermal instability) -- dashed curves • Shear-parallel rolls always have largest growth rate • For marginally unstable environments, shear-perpendicular rolls are suppressed • For very unstable environments all orientations are unstable
Asai (1970a) • Figure 8 summary • Shear-parallel (longitudinal) rolls always favored • Small instability - shear-perpendicular (transverse) rolls have very small growth rates • Large instability - all possible orientations grow fast • Cells?
Asai (1972) • Thermally unstable but -Ri not varied • Directional and speed shear • Case I - shear vector still constant w/ z • Shear vector is NW-SE in example • Figure 2: growth rate max for Lx = Ly • Rolls still line up parallel to shear vector • Case 2 - shear vector turns with height • Figure 6: three maxima (two shown) • Parallel to shear in upper part of shear layer • Parallel to shear in lower part of shear layer • Perpendicular to shear (inflection point instability)
Asai (1972) sign convention Wavelengths are Lx, Ly Wavenumbers are Kx, Ky Both can be negative depending on roll orientation For NW-SE rolls Kx, Ky >0 and Lx, Ly > 0 Ly > 0
Asai (1972) Case I surface wind shear vector wind aloft Asai Case 1: Shear NW-SE (above) Schematic showing result: rolls parallel to shear vector and not to winds at any level (note not same specific situation as Case I)
Asai (1972) Case I • Axes are E-W and N-S wavenumbers • Contoured is amplification rate • Shear oriented NW-SE • Largest growth rate for rolls with Lx = Ly > 0; i.e., aligned along shear vector • Growth rate max for inter- mediate wavelengths
Asai (1972) Case II Shear vector varies w/ Height Upper layer shear remains NW-SE Note V component has inflection point(s) [at z=.25 and .75] >>> U component does not (not shown)
Asai (1972) Case II • Fig. 6 - largest amplification rate again “nearly parallel” to shear vector (i.e., Kx = Ky) in upper part of layer (actually, they’re turned at some CCW angle to shear vector) • Rolls “parallel” to shear vector in lower part of layer also appeared but are NOT shown (Ky < 0) • Also a local max in amplification rate for rolls parallel to y-axis (Ky = 0) with long wavelengths (unexplained by Asai) More…
Asai (1972) Case II • Another locally large amplification rate occurs for Kx = 0 (rolls parallel to x-axis, at angle to shear) > That is inflection point instability which produces rolls oriented perpendicular to the wind component with the inflection point (here, the v component)
Asai (1970a) Case II • Fig. 7 - when thermal instability removed, only dynamical instability (inflection point instability) remains • This proves the other local maxima were due to thermal instability
Revisit ARPS simulation shear vector v u shear vector turns w/ z
Vertical profiles of t=93 min t=3 min
RUN03 Shear vector veers with height Little surface wind
Lack of rolls in RUN03… • Not enough shear? • Too much directional shear? • Not enough wind near surface? (Needed for surface heat flux)
RUN11 same shear, added mean wind Smaller domain; same aspect ratio
RUN06 - no (initial) shear Shear created by surface friction t=60min t=0 note small values
RUN07 no initial shear, no drag t=60min Variation is very, very small t=0
RUN07 no initial shear, no drag Cross-roll flow develops inflection point, but shear VERY small t=60min t=0
Rolls vs. cells • Monin-Obukhov length L • Ratio of vertical momentum flux to vertical heat flux (negative for strongly heated surface) • L magnitude large when heat flux small (i.e., early in day); decreases through afternoon • Boundary layer depth zi • -zi/L is large when PBL is very unstable • Deardorff (1972): rolls exist for -zi/L between 0 and 45 • Other studies came up different ranges • Generally, with larger -zi/L rolls less likely • Therefore, rolls can change to cells as surface heats up
Rolls vs. cells Early in day: no structure Nolan Atkins
Rolls vs. cells Surface heating increases; rolls appear Nolan Atkins
Rolls vs. cells Stronger heating; cells replace rolls Nolan Atkins
Weckwerth’s experiments Roll behavior as function of surface heat flux QH Plots at right show autocorrelation rather than vertical velocity Rolls less coherent as surface heat flux increased; Turn CCW a bit first… Weckwerth et al. (1997)
Weckwerth’s experiments Roll behavior as surface wind speed increased Light surface winds -- rolls or cells? Rolls more coherent as surface wind increased Weckwerth et al. (1997)
Roll wavelength • Kuettner (1971) observations/theory • So as boundary layer grows, horizontal roll spacing increases
Weckwerth’s experiments zi 1.1 km 1.6 km 2.0 km Varied PBL depth Roll wavelength larger as PBL depth increases Weckwerth et al. (1997)
A few questions • Experiment with surface heating; are rolls easier to get with less forcing? • Experiment with near-surface wind speeds; why does increasing the wind make better rolls? • Experiment with different shear profiles; can you get shear-parallel and shear-perpendicular rolls simultaneously? What would that look like?