Download
1 / 49
490 likes | 611 Views
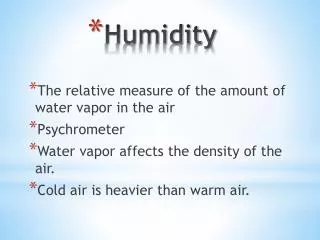
The Tropospheric Humidity Trends of NCEP/NCAR Reanalysis before Satellite Era. Shi-Keng Yang (SKY) Masao Kanamitsu Wesley Ebisuzaki Gerald Potter Sept-Oct, 2003, CWB, Taipei. The Problem. Outline. LWCF CSOLR & OLR RH Natural variability from AMIP ensemble

E N D
The Tropospheric Humidity Trends of NCEP/NCAR Reanalysis before Satellite Era Shi-Keng Yang (SKY) Masao Kanamitsu Wesley Ebisuzaki Gerald Potter Sept-Oct, 2003, CWB, Taipei
Outline • LWCF CSOLR & OLRRH • Natural variability from AMIP ensemble • RH & T trends sampled from 30 Stations • Chronology of measurement changes • A Hygrometer Simulator • Conclusion • Ideas for Taiwan Area Regional Reanalysis
What are the causes? • Natural variability? • Instrument changes? • Algorithm/System changes? Station increases?
The Attributes of Reanalysis GDAS and the Model used for AMIP runs Reanalysis AMIP-ensemble10 • Convection Scheme SAS RAS • SW Radiation Lacis & Hansen (1974) Chou et al (1992, 96) • Boundary Layer Local Diff Non-Local • Orography Mean Smooth Enhanced • Resolution T62L28 T42L24 • Soil Moisture w/ nudging interactive • Snow Obs (fixed on ‘72) Climatology • Radiation Resolution Linear grid/hourly Guassiagrid/hourly
Red – 300 hPa Yellow – 500 hPa Green – 700 hPa Black – 850 hPa
Red – 300 hPa Yellow – 500 hPa Green – 700 hPa Black – 850 hPa
Green – 75~79 RH mean Black – 49~53 RH mean
T Profiles from 36-month means Green – 76~78 Black – 49~51
RH Profiles from 36-month means Green – 76~78 Black – 49~51
A Chronology of changes in the US Radiosonde Network from Elliott and Gaffen (1991) plotted on LWCF anomaly to demonstrate the probable impacts. • 1: 1957 observation time changed on IGY; • 2: 1960 introduced white-coated temperature elements; • 3: 1965 Introduced carbon humidity element; • 4: 1969 changed from manual system to a time-share computer system; • 5: 1972 redesigned relative humidity ducts introduced; • 6: 1973 “motorboating” lower RH values as 19% when measured lower than 20%; • 7: 1974 introduced semi-automatic mini-computer-based system; • 8: 1979 Satellite measurements incorporated into Reanalysis; • 9: 1980 New carbon hygristors introduced; • 10:1985 Introduced fully automatic mini-computer-based system; • 11:1988 Introduced Precalibrated hygristor replacing individual preflight calibration; • 12:1988 Introduced new VIZ sonde with new humidity duct; • 13:1989Introduced fully automatic micro-computer-based system.
Sensor in Use • Goldbeaters Skin • (Russia, China) • Carbon Hygristor • (USA[part], India, China?) • RS80 Humicap A or H • (50% of global net work) • RS90 Humicap • (Finland +??) • Meteolabor “Snow White” • (working reference)
Challenge of Radiosonde water vapor measurementsI • Very large range of saturation vapor pressure with temperature • 20 oC 23 hPa • -20 oC 1.2 hPa • -50 oC 0.04 hPa • -80 oC 0.0005hPa
Challenge of Radiosonde water vapor measurementsII • Sensor temperature induced error • @ 20 oC 6%/deg wrt water • @-20 oC 7%/deg wrt water • @-50 oC 7%/deg wrt water
Radiosonde intercomparison experimentJohn Nash, UK Met Office
Radiosonde intercomparison experimentJohn Nash, UK Met Office
Radiosonde intercomparison experimentJohn Nash, UK Met Office
Radiosonde intercomparison experimentJohn Nash, UK Met Office
Hygristor Time constants • Carbon hygristor 1~2 sec at sfc • Thin Film 1~2 sec at sfc • Goldbeater, Hair >10 sec at sfc, 5min 300 hPa
Hygrometer simulatoran educational toy • l (T) = 3+ 5(15-T), T< 15 C Time-lag constant of a hygristor is a function of temperature. Based on Nash and Schmidlin, 1987, we determine that the rate of increase to be 5 sec/ K, so that the time-lag constant can reach 5 minutes at 300 hPa, where the temperature is lower than -40oC. Balloons ascend at 15 f/s. RH(i) = RHe + (RH (i-1) - RHe ) exp (-t/l(T))
Conclusion • The trend of upper air humidity within NCEP/NCAR Reanalysis appears to be an artifact, caused by long time-lag constant in the older hygrometers, and other factors. • Implies that similar problems, in general, in the time- series radiosonde time-series before the satellite era. • Significant implication on the earth energy balance and cloud fields of the Reanalysis. • No humidity climatology yet! • Suggestions: future Reanalyses includes a special fixed observation system sub-analysis using only the limited well-known, high quality, well calibrated, fixed number stations for GDAS, such that a baseline reference analysis for the full analysis can be established .
Ideas for Taiwan Area Regional Reanalysis • Homogeneous High Resolution Environmental Database suitable for comprehensive applications (3000 papers published using R-1) • An Integration of modern analysis-assimilation system with historical data. Optimization the use of historical data. • Periodical Benchmarks of Science-Technology advancement
Some guidelines • Build a system that you can do analysis the 2nd easier than the 1st time • Analysis- ReAnalysis- On-going Reprocess • Analysis Design –Evaluation Cycle ( once every 5~10 years for global) • Modular Analysis System Design • Calibration of measurements and Products • Multiple Stage Process • Multiple Stage Monitoring [ level 3 -> 2 -> 1; 100M/sec max cap by a person] • Multiple Stage Archival • Other principles • Process team is the analysis team, stack holder • Periodical Outside Evaluation • Re-packaging at each cycle • Start with EDR, and recycle for CDR • Mutiple algorithms if possible.
Office of Global Programs Status: NCEP Regional Reanalysis N C E P Geoff DiMego (NCEP/EMC) Eugenia Kalnay (U Md) Fedor Mesinger (UCAR) 15 March 2000 Where America’s climate and weather services begin
O B J E C T I V E • A long-term set of consistent climate data produced at a regional scale • 51 Years of the NCEP/NCAR Global Reanalysis have been completed!
Regional Reanalysis Rationale • NCEP’s Meso Eta Model produces more accurate data assimilation and forecast results than the current global system. • Improved data sources and techniques are available to improve upon the Global reanalysis • Higher resolution for North American domain • 32 km / 45 layer Meso Eta regional reanalysis • T62 (~200 km) / 28 layers global reanalysis
Eta 2m temperature Eta 2m specific humidity AVN 2m temperature AVN 2m specific humidity
Eta skin temperature Eta soil moisture 0-10cm AVN skin temperature AVN soil moisture 0-10cm
Regional Reanalysis Features • Unique resources can be added to the global reanalysis baseline: • assimilation of observed precipitation & cloud • direct analysis of satellite radiances with 3DVAR • mature Meso Eta Model due, in part, to GCIP supported developments • Additional data sources • 22 year period to be reanalyzed: 1982-2003