1 / 57

NEW ICAO WEB SITE

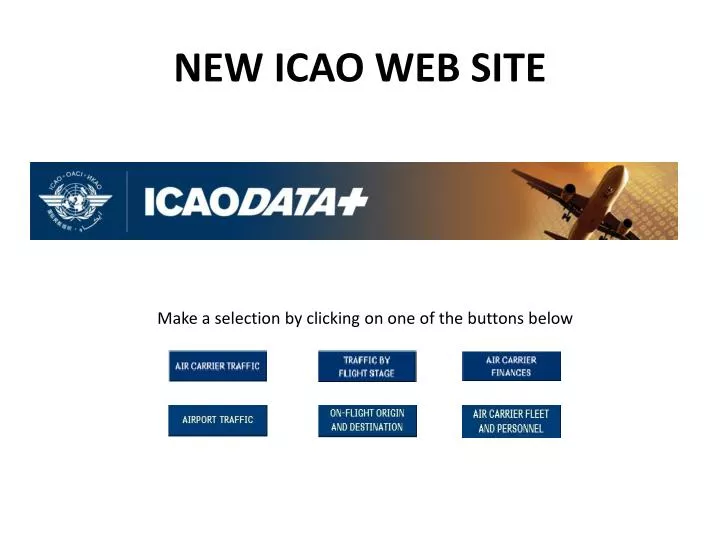
NEW ICAO WEB SITE. Make a selection by clicking on one of the buttons below. (ACT). View recently reported data. Download your data to Excel. R eview development of air carriers from same State. Compare monthly variations. Review annual trends. Benchmark competition.

arien
Download Presentation

NEW ICAO WEB SITE

An Image/Link below is provided (as is) to download presentation Download Policy: Content on the Website is provided to you AS IS for your information and personal use and may not be sold / licensed / shared on other websites without getting consent from its author. Content is provided to you AS IS for your information and personal use only. Download presentation by click this link. While downloading, if for some reason you are not able to download a presentation, the publisher may have deleted the file from their server. During download, if you can't get a presentation, the file might be deleted by the publisher.

E N D

Presentation Transcript


  1. NEW ICAO WEB SITE Make a selection by clicking on one of the buttons below

  2. (ACT)

  3. View recently reported data

  4. Download your data to Excel

  5. Review development of air carriers from same State

  6. Compare monthly variations

  7. Review annual trends

  8. Benchmark competition

  9. View regional contribution to global air transport

  10. Compare regional variations

  11. Compare traffic variations by State

  12. Click on slide to continue to next Module

  13. (ACT)

  14. Select data by (i) city-pair

  15. Select data by (ii) country-pair

  16. Select data by (iii) air carrier

  17. Download selection into MS Excel

  18. Market penetration by (i) air carrier

  19. Changes in market penetration

  20. Market penetration by (ii) aircraft manufacturer

  21. Aircraft utilization from/to a State/city

  22. Inter-regional traffic distribution

  23. Click on slide to continue to next Module

  24. (ACT)

  25. Air carriers profit and loss account

  26. Download selection into MS Excel

  27. Air carriers balance sheet

  28. Yield comparison and breakdown

  29. Unit cost comparison and breakdown

  30. Percentage breakdown of revenues and expenses

  31. Yearly trend in yields/unit costs

  32. Air carrier revenues and expenses by region

  33. Air carrier financial results by region

  34. World air carrier trends in revenues and expenses

  35. Click on slide to continue to next Module

  36. (ACT)

  37. See the monthly traffic data reported to date

  38. Check the airport ranking and compare the monthly traffic development

  39. Compare freight and total traffic handled

  40. Compare the monthly traffic development with the previous year

  41. Click on slide to continue to next Module

  42. (ACT)

  43. Select data by city-pair

  44. …or by country-pair

  45. Compare traffic within regions

  46. …and between regions

  47. Check the use of traffic rights

  48. …or the development of cabotage within Europe

  49. Click on slide to continue to next Module

  50. (ACT)

More Related