Download
1 / 14
140 likes | 261 Views
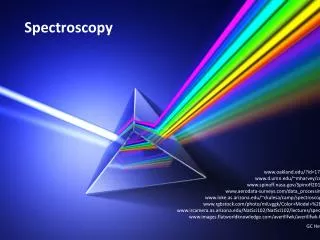
Bios 532 Laboratory Module in Spectroscopy http://www.bioc.rice.edu/bios532/bios532.html Instructor: Susan Cates Keck 312, X5777 mscates@rice.edu NO CLASS - November 8, 20, 22. Teaching Aims. Principles of Spectroscopy (practicum) Proper Equipment Usage Advanced Data Analysis

E N D
Bios 532 • Laboratory Module in Spectroscopy • http://www.bioc.rice.edu/bios532/bios532.html • Instructor: Susan Cates • Keck 312, X5777 mscates@rice.edu • NO CLASS - November 8, 20, 22
Teaching Aims Principles of Spectroscopy (practicum) Proper Equipment Usage Advanced Data Analysis Reporting Scientific Results
General Principles for Operating Specs Turn on instrument before CPU Warm up lamp Initialize software after machine has been initialized Trouble-shooting - try shutting everything down and reinitializing the apparatus, carefully following correct procedure. a. Xenon short arc lamp? (CD and fluorometer) Requires fan or cooling usually b. Hot light sources burn less erratically after warm-up Watch the screen - most software will indicate correct initialization vs. error
Lab Reports Background/Introduction Materials and Methods Results/Experimental Data Discussion/Analysis Conclusion
Background/Introduction written for someone with general scientific background - the point - to briefly, yet clearly identify: “What question does this work address?” “How does this experiment/apparatus/technique answer the question?” General background on your molecule of study- pertinent details might include source organism, localization, function. Review current knowledge of properties you will study. For example, if you are measuring Hb O2 binding, discuss cooperativity in Hb. c. Discuss why the experimental technique is appropriate for the problem.
Materials and Methods in general, the purpose of the materials and methods section of any scientific paper is REPRODUCIBILITY. Identify apparatus and technique You do not have to rewrite the lab protocol for Bios 532 reports - just reference the protocol. (In papers for publication, grant proposals and progress reports, you should write out all your protocols.) You do have to mention any deviations from the protocol,; e.g., spectra were collected according to the course protocol except the increase in absorbance was monitored at 330 nm instead of 280 because … You do not have to mention all buffers, additives, if they are in the lab protocol, but BE AWARE of your materials - you must know your buffers, additives for proper interpretation of data and for proper troubleshooting. e. The exception to item (d) are cases where calculations are required to determine proper concentration, or an aliquot worksheet has been handed out with the lab - you do have to include these in the report.
III. Results/Experimental Data Raw Data The general rule in the biosciences is NOT to include the raw data in the write-up. There is usually an overabundance of raw data, often in a format that is not meaningful to the reader. Tabulated/Calculated Data Data is usually shown in a graph, table or summary form (mean values, etc.). You must show at least one sample calculation and there is more chance for partial credit if you include all your calculation columns in your data table. (Methods - show formula, or Results - sample calculation.) Present ALL Data - if the protocol asks you to record data, put the results in the lab report, even if there is not a specific question about that data in the lab protocol calculations section.
Proper presentation of data requires some thought. Examples for Data/Results Section: Measuring affect of additive on a protein’s UV/VIS spectrum: Instead of overlaying multiple spectroscopic wavelength scans Taken after the addition of another aliquot of additive, you might show a graph of the change in absorbance at one wavelength as a function of the concentration of the additive. In this example, it would be crucial to pick (1) the right wavelength. (2) the best axes ranges for your graph.
Bad graph Poor choice of left axis range
Good graph • Axes labels • Units • Proper axis range • Legend • Title • Independent variable usually on bottom axis
Rice Interdisciplinary Web-Based Teaching Laboratory Materials http://www.ruf.rice.edu/~bioslabs/tools/tools.html This web page contains pdf references for proper reporting procedures for scientific papers, laboratory reports and notebooks.
IV. Discussion/Analysis always compare your results with the current literature. If you have been given a paper on PMB-binding to Hb in this course, and then you are asked to perform an experiment measuring UV/VIS absorbance changes in Hb as a result of addition of PMB, you definitely should compare your results to the results in the paper. Postulate (why?) - be clear on the difference between a postulation and a statement of fact, but discuss what you think is happening.
V. Conclusion Summarize the big picture. This often involves considering the background, adding your results/discussion and coming up with the revised story. Our results (do not) support the hypothesis that…. Important: proofread, spell check
Considerations while writing Bios 532 lab reports: • Data presentation - graph? table? • Data analysis • a. appropriate precision (significant figures) • b. raw data conversion (appropriate units, physically meaningful values) • c. appropriate analytical method(s) • d. interpretation of relevance of results (application) • e. integration of knowledge • results and conclusions "make sense"? can you recognize blatant errors? • Laboratory procedures • a. followed protocol • b. scientific method (controls, biased toward hypothesis in spite of contrary evidence?) • c. safety, awareness of environment • d. troubleshooting, critical thinking • records (log) – reproducible? • Background