Download
1 / 27
270 likes | 497 Views
Major Points. An example Sampling distribution Hypothesis testing The null hypothesis Test statistics and their distributions The normal distribution and testing Important concepts. Distribution of M&M’s in the population. Yellow 20%. Brown 30%. Orange 10%. Blue 10%. Red 20%.

E N D
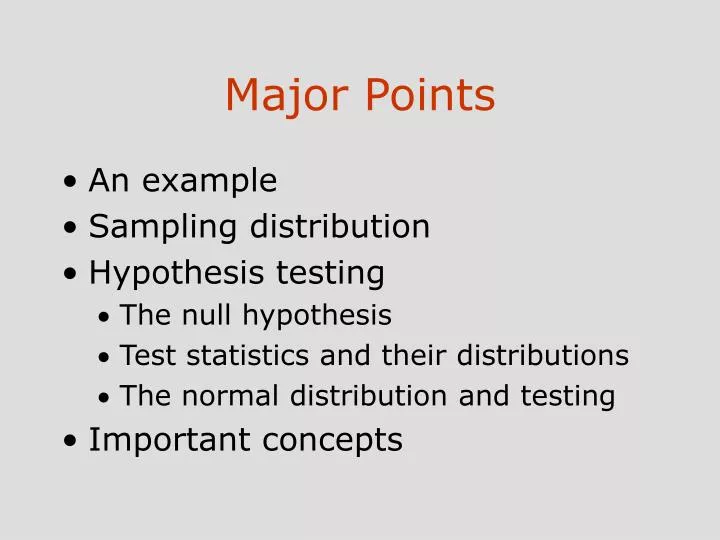
Major Points • An example • Sampling distribution • Hypothesis testing • The null hypothesis • Test statistics and their distributions • The normal distribution and testing • Important concepts
Distribution of M&M’s in the population Yellow 20% Brown 30% Orange 10% Blue 10% Red 20% Green 10% Original Distribution
Testing one sample against population • There are normally 5.65 red M&M’s in bag (a population parameter) • Mean number of red M&M’s in a halloween candy bag = 4.56 (a sample statistic) • Are there sufficiently more red M&M’s to conclude significant differences / the two numbers come from different populations.
Understanding the theoretical and statistical question • Theoretical Question • Did M&M use a different proportion of red ones for Halloween? • Statistical Question: • Is the difference between 5.65 and 4.25 large enough to conclude that it is a real (significant) difference? • Would we expect a similar kind of difference with a repeat of this experiment? • Or... • Is the difference due to “sampling error?”
Sampling Error • Often differences are due to sampling error • Sampling Error does not imply doing a mistake • Sampling Error simply refers to the normal variability that we would expect to find from one sample to another, or one study to another
How could we assess Sampling Error? • Take many bags of regular M&M candy. • Record the number of red M&M’s. • Plot the distribution and record its mean and standard deviation. • This distribution is a “Sampling Distribution” of the Mean
Sampling Distribution Number of Red M&M’s in the population 1400 1200 1000 800 Frequency 600 400 Std. Dev = .45 200 Mean = 5.65 0 3.75 4.00 4.25 4.50 4.75 5.00 5.25 5.50 5.75 6.00 6.25 6.50 6.75 7.00 7.25 Means of various samples of Brown M&M’s
What is Sampling Distribution • The distribution of a statistic over repeated sampling from a specified population. • Can be computed for many different statistics
Number of Red M&M’s 1400 1200 1000 800 Frequency 600 400 Std. Dev = .45 200 Mean = 5.65 N = 10000.00 0 3.75 4.00 4.25 4.50 4.75 5.00 5.25 5.50 5.75 6.00 6.25 6.50 6.75 7.00 7.25 Mean Number Aggressive Associates • Distribution ranges between 3.76 and 7.25 • Mean is 5.65, SD is .45 • Mean of 4.00 is not likely, mean of 5 is more likely
How likely is it to get score as low as 4.25 by chance. • Convert score to z score (z distribution has a mean of 0 and standard deviation of 1) • score - mean / standard deviation • Look up Table E10, smaller portion Score Z Score Probability 4.25 -3.1 .0006 5.60 -.11 .45 7.5 3.5 .0002
Hypothesis Testing • A formal way of testing if we should accept results as being significantly different or not • Start with hypothesis that halloween M&M’s are from normal distribution • The null hypothesis • Find parameters of normal distribution • Compare halloween candy to normal distribution
The Null Hypothesis (H0) • Is the hypothesis postulating that there is no difference, that two things are from the same distribution. • The hypothesis that Halloween candy came from a population of normal M&M’s • The hypothesis we usually want to reject. • Alternative Hypothesis: Halloween and Regular M&M’s are from different distributions
It is easier to prove Alternative Hypothesis than Null Hypothesis • Hypothesis: All crows are black • Sample: 3000 crows • Results: all are black • Conclusion: Are all crows black?
Observation: One white crow • Conclusion: Statement :Every crow is black” is false • It is easier to prove alternative hypothesis (all crows are not black) than null hypothesis (all crows are black)
Another example of Null & Alternative Hypothesis • Hypothesis: Shopping on Amazon.com is different than on BN.com • Study: 100 usability tests comparing the two shopping process on both • Results: Both sites performed similarly • Conclusion: ?
Observation: On Test No:101 Amazon did better • Conclusion: Amazon.com and BN are different.
Steps in Hypothesis Testing • Define the null hypothesis. • Decide what you would expect to find if the null hypothesis were true. • Look at what you actually found. • Reject the null if what you found is not what you expected.
Important Concepts • Concepts critical to hypothesis testing • Decision • Type I error • Type II error • Critical values • One- and two-tailed tests
Decisions • When we test a hypothesis we draw a conclusion; either correct or incorrect. • Type I error • Reject the null hypothesis when it is actually correct. • Type II error • Retain the null hypothesis when it is actually false.
Type I Errors • Assume Halloween and Regular candies are same (null hypothesis is true) • Assume our results show that they are not same (we reject null hypothesis) • This is a Type I error • Probability set at alpha () • usually at .05 • Therefore, probability of Type I error = .05
Type II Errors • Assume Halloween and Regular Candies are different (alternative hypothesis is true) • Assume that we conclude they are the same (we accept null hypothesis) • This is also an error • Probability denoted beta () • We can’t set beta easily. • We’ll talk about this issue later. • Power = (1 - ) = probability of correctly rejecting false null hypothesis.
Critical Values • These represent the point at which we decide to reject null hypothesis. • e.g. We might decide to reject null when (p|null) < .05. • Our test statistic has some value with p = .05 • We reject when we exceed that value. • That value is the critical value.
One- and Two-Tailed Tests • Two-tailed test rejects null when obtained value too extreme in either direction • Decide on this before collecting data. • One-tailed test rejects null if obtained value is too low (or too high) • We only set aside one direction for rejection.
One- & Two-Tailed Example • One-tailed test • Reject null if number of red in Halloween candies is higher • Two-tailed test • Reject null if number of red in Halloween candies is different (whether higher or lower)
Designing an Experiment: Feature Based Product Advisors Identify some good online product advisors Feature Based Filtering: CNET Digital Camera Advisor Basic Sony Decision Guide Dealtime Feature Based Choice Multi-Dimension (including features) based filtration Sony Advanced Decision Guide Review Based Choosing Epinions CNET Computers / Cameras / both; Sample Size; Experimental Questions