Download
1 / 20
200 likes | 474 Views
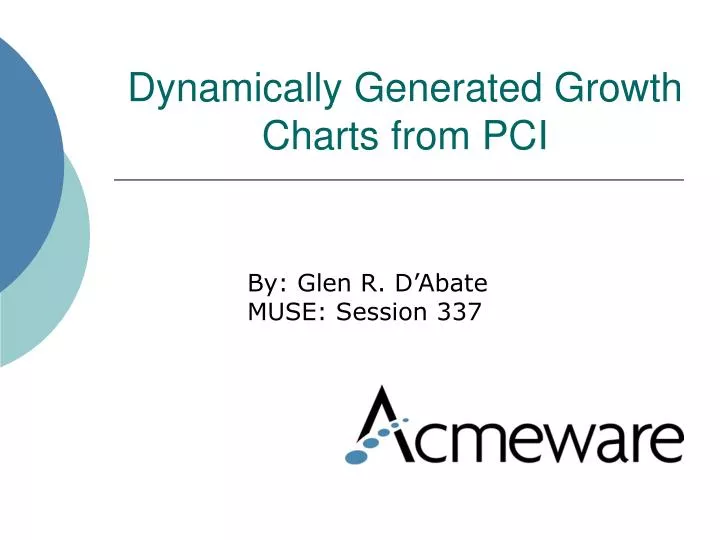
Dynamically Generated Growth Charts from PCI. By: Glen R. D’Abate MUSE: Session 337. Session Agenda. Overview of the project and objectives Design strategies Workflow review Example reports Technologies utilized Other applications ideas for this project Questions, answers, & discussion.

E N D
Dynamically Generated Growth Charts from PCI By: Glen R. D’Abate MUSE: Session 337
Session Agenda • Overview of the project and objectives • Design strategies • Workflow review • Example reports • Technologies utilized • Other applications ideas for this project • Questions, answers, & discussion
Project Parameters • Affinity Health Care had a desire to automate the charting of children’s height, weight and head circumference (infants only) • Ideally, patient would receive an updated chart with latest data-point before departing an office exam • Data was currently being collected in a LSS Practice Management System and integrated within the MEDITECH DR
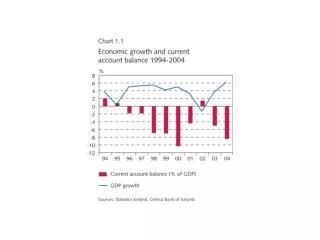
Do you remember these? “Monitoring physical growth is fundamental to pediatric health care delivery” 1 Data is updated periodically by CDC 1. AmeriHealth Web site
Centers for Disease Control & Prevention Opportunities for many more projects! CDC Growth chart Data and Statistics
Clinical Growth Chart Options “The growth charts consist of a series of percentile curves that illustrate the distribution of selected body measurements in U.S. children.”2 Different options for percentile lines included Different statistics available for age bands and gender Scaled to metric or English units 2. CDC Web site
The Old Way of Doing Things • A CDC-based paper chart is printed when a patient is born and placed in a medical record folder • Each time a patient has an annual office visit, the old chart is modified by manually charting the new data point on the old chart • The patient is given a photocopy of the latest chart before departing
Schematic of New Process Practitioner performs exam on patient Height / weight data is collected at beginning of exam Patient departs with chart Data entered in the LSS Practice Management System Patient arrives for exam Chart generated includes CDC growth data overlaid with patient’s prior and current growth data Information stored in DR
Advantages Realized with Project • Take advantage of electronic entry of pediatric growth data • No need to manually chart data points or photocopy old paper charts • Patient charts can contains current medical record data beyond growth data if required • Updated data for CDC charts can be easily incorporated • Purging from the transaction system will not result in an incomplete chart • Flexibility to improve report layout with use of colors, fonts, images, etc.
Automated Update of Chart Data New chart statistics are available immediately CDC Updates Growth Statistics Guidelines are changed Hey! I used to be taller than average Download / update process performed by a single DR process
Changes Needed to PCI(thanks Iatric Sys!) • To launch Acmeware Growth Charts from PCI, the command line "Non MEDITECH Data Source" feature is used • Use Z.link.to.other on a menu to call a macro as a program instead of using a report • “Pediatric Growth Charts” option added to PCI main menu for patients 21 and under • List of available growth charts displayed based on data available for patient • Charts are displayed using data from DR and presented in an Internet Explorer (web-browser) session • Reports are printed from web-browser application • Exiting session returns user back to PCI
Test patient with all available reports Patient Care Inquiry Menu of available reports / charts for patient New option to launch Acmeware Growth Charts
Patient Header Example Chart #1 Internet Explorer Options Percentile lines are color-coded Pediatric growth chart for head circumference (0-36 months) Percentile Legend Only two data points entered in test database for this example Report also provides a a tabular spreadsheet detailing age, head circumference, and CDC percentile
PCI Test Example #2 Test patient under 21 years of age with valid pediatric chart data in DR
Example #2 – Age / Weight 24+ Months Many options for saving / printing file Example patient with data from Age 2yrs through Age 20yrs
Getting Data to DR Quickly! • 5.4 Multi-threaded application transfers introduced to C/S (MAGIC could always do this) • 5.6 DTS DR (MAGIC 4336, C/S 2649) allows transfer grouping at the NPR segment level (a.k.a. “split transfers”) • Working with LSS to introduce the same functionality…so far, so good • Acmeware Table Monitoring Software proves ability to evaluate success of near real-time transfers
Technology Overview • Requires PCI Z.link.to.other menu call (no customization needed). Can also be accomplished in EMR with minor custom enhancement by MEDITECH • SQL Server 2000 or 2005 RDMS with MEDITECH Data Repository 5.62 or later installed • Capture of pediatric growth data in PRV, LSS, or another accessible source • DTS or SSIS of downloadable growth chart data from Centers for Disease Control (CDC) • SQL Server Reporting Services (2005) {needed for quality chart control} • Internet Information Server (IIS) as Web Server where dynamically generated SSRS pediatric growth chart reports are posted • Internet Explorer (web-browser) to view and print charts • Note, not one line of programming code (SQL excluded) was needed for this project
SQL Server Reporting Services Five available reports Pediatric Growth Chart Reports need not be launched from PCI/EMR, they can be accessed (with appropriate permissions) directly from SSRS Report Manager Enter Unit # Directly
Other Applications of this Technology • Charting any discrete data captured in a MEDITECH system (MAGIC or C/S) where charts, graphs, plots, etc. are not available • Launching reports that display patient specific data from a non-MEDITECH application within PCI or EMR • Launching into other DR related technologies such as On-Line Analytical Processing (OLAP) for the purposes of dynamic data analysis
Discussion, Questions & Answers Thank You!