Download

1 / 50
520 likes | 780 Views
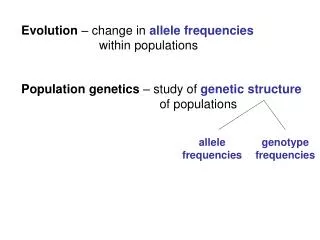
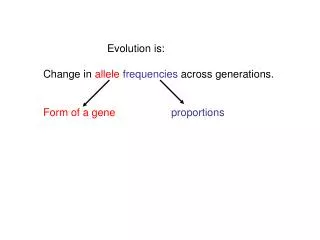
When Allele Frequencies Stay Constant. Ch 14. Population Genetics. Genes can be considered at the POPULATION level. Population = An interbreeding group of the same species in a given geographical area

E N D
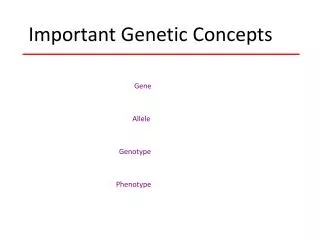
Population Genetics • Genes can be considered at the POPULATION level. • Population = An interbreeding group of the same species in a given geographical area • POPULATION GENETICISTS don’t care about individuals or families, but are interested in the GENE POOL that is available. • Gene pool = The collection of all alleles in the members of the population • If we look at a POPULATION and determine the GENE POOL, we can then determine the ALLELE FREQUENCY for each.
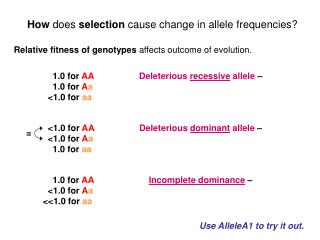
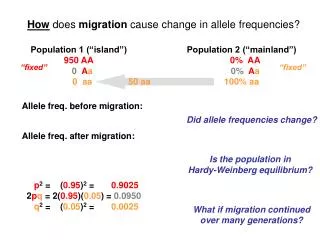
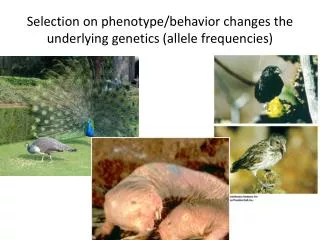
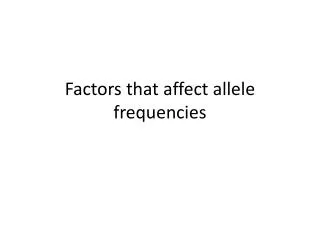
Allele Frequencies Change • ALLELE FREQUENCIES can change when: • One genotype confers a reproductive advantage. • MIGRATION occurs between populations. • Subgroups in a population become REPRODUCTIVELY ISOLATED • MUTATION changes ALLELES or introduces new ones • NATURAL SELECTION occurs.
A small change in ALLELE FREQUENCY is a MICROEVOLUTION, and over time, MACROEVOLUTION (the formation of a new species) can occur. • Gene Flow = Movement of alleles between populations when people migrate and mate
Hardy-Weinberg equilibrium provides a framework for understanding how populations evolve.
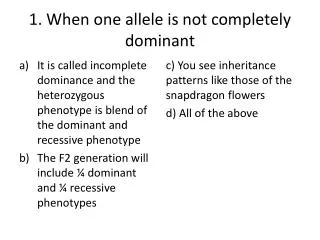
Hardy-Weinberg equilibrium describes populations that are not evolving. • Biologists use models to study populations. • Hardy-Weinberg equilibrium is a type of model.
Hardy-Weinberg equilibrium • Genotype frequencies stay the same if five conditions are met. • very large population: no genetic drift (reproductive isolation) • no emigration or immigration: no gene flow • no mutations: no new alleles added to gene pool • random mating: no sexual selection • no natural selection: all traits aid equally in survival • If “p” and “q” are constant from generation to generation, the population is in HARDY- WEINBERG EQUILIBRIUM.
Hardy-Weinberg equilibrium describes populations that are not evolving. • Real populations rarely meet all five conditions. • Real population data iscompared to a model. • Models are used tostudy how populationsevolve.
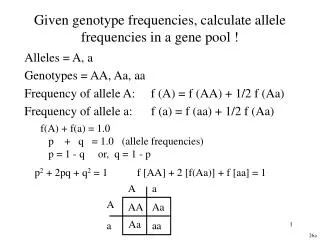
H-W Equation • If “p” and “q” are constant from generation to generation, the population is in HARDY-WEINBERG EQUILIBRIUM. • The full H-W Equation is p2 + 2pq + q2 = 1, which will help us to determine the PHENOTYPIC RATIOS in a population that is at EQUILIBRIUM: • p = the frequency of the DOMINANT ALLELE • q = the frequency of the RECESSIVE ALLELE • The number of homozygous dominant individuals in the population will be “p2” or p*p. • The number of homozygous recessive individuals in the population will be “q2” or q * q. • The rest of the population will be heterozygous – there are 2pqheterozygotes
"The Hardy-Weinberg equation is based on Mendelian genetics. It is derived from a simple Punnett square in which p is the frequency of the dominant allele and q is the frequency of the recessive allele." The Hardy-Weinberg equation is used to predict genotype frequencies in a population. • Predicted genotype frequencies are compared with actual frequencies. • used for traits in simple dominant-recessive systems • must know frequency of recessive homozygotes • p2 + 2pq + q2 = 1
The EQUATION is only possible in an IDEALIZED POPULATION. • Expressed genes (EXONS) are rarely in H-W EQUILIBRIUM because NATURAL SELECTION is OCCURING. • For “non-coding”genes (which aren’t expressed – INTRONS) the DNA is often in EQUILIBRIUM • 95% of the DNA is “junk” DNA
Hardy-Weinberg Equation Developed independently by an English mathematician and a German physician Used algebra to explain how allele frequencies predict genotypic and phenotypic frequencies in a population of diploid, sexually-reproducing species Disproved the assumption that dominant traits would become more common, while recessive traits would become rarer
Dominant traits DO NOT take over in a population • Example: • “D” codes for normal middle finger length length (70%) • “d” codes for shorter finger in 30% of the alleles • DD (pp) is equal to 0.49 • dd (qq) is equal to 0.09 • Dd (2pq) is equal to 0.42 • 9/100 will have a shorter middle finger • 91/100 will have a “normal” middle finger
12.3- Applying Hardy-Weinberg Equilibrium • H-W is used to determine CARRIER RISK for Genetic Diseases. • For autosomal recessive diseases, the homozygous recessive class is used to determine the frequency of alleles in a population - Its phenotype indicates its genotype • CF affect 1 in 2000 CAUCASIAN newborns • 1/2000 = 0.0005 = q2 • q = 0.0005 = 0.022 • the CF allele frequency (q) is 0.022 or (22/1000) • the “normal” allele frequency is p = 1- 0.022 = 0.978 • the CARRIER FREQUENCY is 2*p*q • 2(0.9780)(0.022) = 0.043 • as a fraction that is 1/23 • the odds of BOTH parents being CARRIERS and the affected sperm meeting the affected egg is (1/23)(1/23)(1/4) = 1/2000
Applying H-W to Sex Linked Traits • SEX LINKED TRAITS are slightly different because of the male only needing to receive one “dose” from a parent. • For females, the standard Hardy-Weinberg equation applies • p2 + 2pq + q2 = 1 • However, in males the allele frequency is the phenotypic frequency • p + q= 1 • With 1/10,000 males having hemophilia, • q = 0.0001 • p =1 - 0.0001 = 0.9999 • Carrier Frequency (females) 2pq = 2(0.001)(0.9999) = 0.00019 = ~1/5000 • Affected females = q2 = (0.0001)(0.0001) = • Only 1/100,000,000 females have hemophilia
Often q approaches 0 if a trait is rare enough, which makes the carrier frequency simply TWICE the frequency of the trait. • A POLYMORPHISM is a DNA sequence that VARIES in at least 1% of a POPULATION at a particular GENE LOCUS • It is too frequent to be the result of MUTATION • This makes possible DNA Profiling
DNA Finger Printing/Profiling • RESTRICTION ENZYMES are used to cut certain DNA sequences, digesting the DNA in to short “snipets” • If the POLYMORPHISM is present, the DNA will NOT get cut, and a RESTRICTION FRAGMENTLENGTH POLYMORPHISM will result. • Using multiple Restriction Enzymes, we can make DNA Fingerprints.
DNA Fingerprinting Ch. 14.4
Technicians working in forensic labs are often asked to do DNA profiling or “finger-printing” to analyze evidence in law enforcement cases and other applications. • In order to do this you compare band patterns produced by cleavage (breakage) of DNA samples when separated on an agarose gel. The band patterns are produce from one sample that represents DNA taken at the crime scene and five samples obtained from suspects in the case.
Restriction Enzymes • Restriction enzymes sit on a DNA molecule and slide along the helix until they recognize specific sequences of base pairs that signals the enzyme to stop sliding. • The enzymes then digest (chemically separate, breaks) the DNA molecule at that site—called a "restriction site"—acting like molecular scissors, cutting DNA at a specific sequence of base pairs.
If a specific restriction site occurs in more than one location on a DNA molecule, a restriction enzyme will make a cut at each of those sites, resulting in multiple fragments. • Therefore, if a given piece of DNA is cut with a restriction enzyme whose recognition site is found at two different locations on the DNA molecule, the result will be three fragments of different lengths.
The length of each fragment will depend upon the location of restriction sites on the DNA molecule. • DNA that has been cut with restriction enzymes can be separated and observed using a process known as agarose gel electrophoresis (carry with electricity).
Agarose Gel Electrophoresis • Electrophoresis separates DNA fragments according to their relative size. • DNA fragments are loaded into an agarose gel slab, which is placed into a chamber filled with a conductive liquid buffer solution. • A direct current is passed between wire electrodes at each end of the chamber.
DNA fragments are negatively charged, and when placed in an electric field will be drawn toward the positive pole. • The matrix (maze) of the agarose separates the DNA fragments by size. • Smaller DNA fragments can move more easily than larger ones. • Over a period of time smaller fragments will travel farther than larger ones. • Fragments of the same size stay together and migrate in single "bands" of DNA.
DNA Fingerprinting • Each person has similarities and differences in DNA sequences. • To show that a piece of DNA contains a specific nucleotide sequence, a radioactive complementary DNA probe can be made that will recognize and bind that sequence. It will create a visible band in the gel. • The relative positions of bands in a gel are determined by the size of the DNA fragments in each band. The size of the fragments reflect differences in individuals’ DNA.
The evidence needed for DNA fingerprinting can be obtained from any biological material that contains DNA: body tissues, body fluids (blood and semen), hair follicles, etc. • The DNA analysis can even be done from dried material, such as blood stains or mummified tissue. If a sample of DNA is too small it may be amplified using PCR techniques. • The DNA is then treated with restriction enzymes that cut the DNA into fragments of various length.
Restriction Digestion of DNA • Because they cut DNA, restriction enzymes are the "chemical scissors" of the molecular biologist. • When a particular restriction enzyme "recognizes" a particular four - or six –base pair (bp) recognition sequence on a segment of DNA, it cuts the DNA molecule at that point.
The recognition sequences for two commonly-used enzymes, EcoRI and PstI, are shown below. • Like all enzymes, restriction enzymes function best under specific pH and temperature conditions.
Visualizing DNA Restriction Fragments • DNA is colorless so DNA fragments in the gel can’t be seen during electrophoresis. • A blue loading buffer, containing two blue loading dyes, is added to the DNA solution. • Staining the DNA pinpoints its location on the gel. When the gel is immersed in a dilute solution of Bio-Safe DNA stain, the dye molecules attach to theDNA molecules trapped in the agarose gel.
To enhance contrast and to easily visualize the DNA bands, excess background stain can be removed from the gel by destaining the gel with water. • When the bands are visible, your can compare the DNA restriction patterns of the different samples of DNA.
Reliability of DNA Evidence • In actual DNA fingerprinting, technicians analyze much larger segments of DNA and many more bands and lanes are produced. These technicians are looking for a specific DNA segment, common to a given population, that will produce a unique banding pattern for each individual. • Two major factors affecting the reliability of DNA fingerprinting technology in forensics are population genetics and genetic statistics.
In humans there are thousands of RFLP loci or DNA segments that can be selected and used for fingerprinting analysis. • Depending on demo-graphic factors such as ethnicity or geographic isolation, some segments will show more or less variation than others. • The degree of variation will affect the statistical odds of more than one individual having the same sequence. • If 90% of a given population has the same frequency in its DNA fingerprinting pattern for a certain DNA segment, then very little information will be attained.
But if the frequency of a DNA pattern turning up in a population for a particular segment is extremely low, then this segment can serve as a powerful tool to discriminate between individuals in that population. • Different populations show different patterns in their genotypes due to the contributions made to their individual gene pools over time.
Profiles for 2 populations of a bug species in different states
Differing number of copies of the same repeat migrate at different speeds on a gel Figure 14.8 Figure 14.8
Therefore, in analyzing how incriminating the DNA evidence is, one needs to ask the question: “Statistically how many people in a population may have the same pattern as that taken from a crime scene: 1 in 1,000,000? 1 in 10,000? Or, 1 in 10?”
DNA Profiling Technique 1) A blood sample is collected from suspect 2) White blood cells release DNA 3) Restriction enzymes cut DNA 4) Electrophoresis aligns fragments by size 5) Pattern of DNA fragments transferred to a nylon sheet
DNA Profiling Technique 6) Exposed to radioactive probes 7) Probes bind to DNA 8) Sheet placed against X ray film 9) Pattern of bands constitutes DNA profile 10) Identify individuals