Download
1 / 41
410 likes | 548 Views
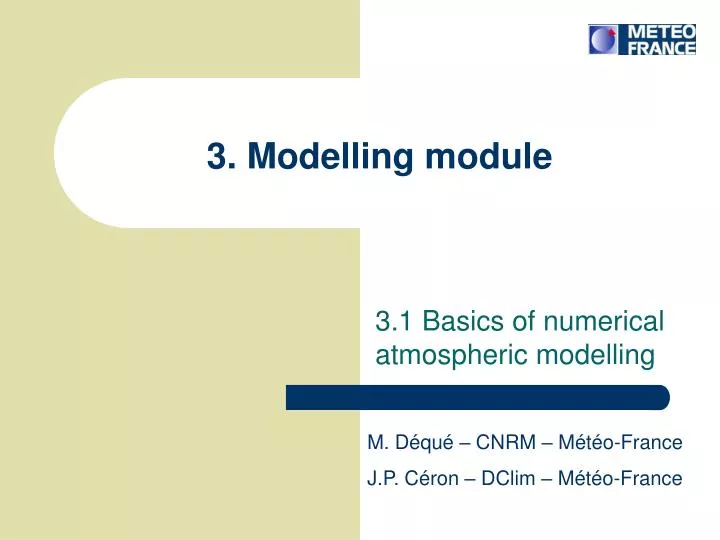
3. Modelling module. 3.1 Basics of numerical atmospheric modelling. M. Déqué – CNRM – Météo-France J.P. Céron – DClim – Météo-France. Building a model: two basic principles. I. EX NIHILO NIHIL II. NATURA NON FECIT SALTU M. Operational organisation. A typical run:.

E N D
3. Modelling module 3.1 Basics of numerical atmospheric modelling M. Déqué – CNRM – Météo-France J.P. Céron – DClim – Météo-France
Building a model: two basic principles I. EX NIHILO NIHIL II. NATURA NON FECIT SALTUM
Operational organisation A typical run: boundarycondition model time t time t + 1 Initial condition forecast
Operational organisation Starting with We get equations using parameters like - pressure (P) - Temperature (T) - Humidity (U) - Wind (V) Physical laws (thermodynamic, Fluide mechanics etc...) TIME EVOLUTION EQUATIONS (P, T, U, V)
Operational organisation one get for a specific time P, T, V, U (initial state) TIME EVOLUTION EQUATIONS (P, T, U, V) Then, using the time evolution equations Initial state t0 One can compute the new state after a time ”D t” (time step) New state at t = t0 + D t
Operational organisation One performe a succession of very short range forecast (D t is in the range of a few minutes) The previous forecast gives the initial state for the next D t corresponds to the ”time step” of the model (it can vary from a few minutes – e.g. 3 minutes for Arpège- up to half an hour for climate models) Initial state t0 t = t0 +D t t = t0 +2D t Final state t = t0 + range of the forecast etc...
Need for assimilation 3D 4D time time • Create a model initial situation from scarse observations • Create model situations very close to observations for verification
Model variables • Altitude • temperature • wind • moisture • Surface • pressure • temperature • snow amount • Soil • temperature • moisture
Dynamic processes • Momentum conservation • Hydrostatic equation • Continuity equation (mass conservation) • Thermodynamic equation (energy conservation) • Water vapour conservation • Perfect gas law • Dynamically passive variables conservation
Parameterisations • Radiation • Convection • Diffusion • Clouds • Precipitation • Orographic gravity wave drag • Soil-snow-vegetation
altitude Discretization In order to decribe the atmosphere, one divide the atmosphere into « cubes » or « parallelepipeds ». The grid of the model corresponds to the horizontal division (the distance between 2 succesives grid points is the mesh). The vertical division define the levels.
altitude Discretization The choice of the horizontal and vertical representation in the model determine the scale of the phenomena that one be able to simulate. This choice should be coherent with the time step of the model and the goal of the forecast. The effect of non resolved phenomena must be parametrized.
Discretization An example for the topography of the model. Real topography profile Topography profil in the model using a doubling of horizontal and vertical resolution Topography profil in the model
Model grids • regular grids • staggered grids • stretched grids • rotated grids • reduced grids • spectral approach • finite elements
Vertical discretization top of the atmosphere The atmosphere is cut in slices (here 31) 200 hPa 400 hPa 600 hPa 800 hPa surface
Time discretization • centered • leap-frog • semi-implicit • decentered • explicit • implicit
Postprocessing predicted precipitation anomaly (mm/d) DJF 1997/98 • instantaneous variables • cumulated variables • grid transformations • vertical interpolations • correction of systematic error predicted temperature anomaly (°C) DJF 1997/98
Space-time scales The scales Space and time scale that should be taken into account depend on the range of the forecast. The longer the range, the larger the domain J+1 ? What is the size of the domain that should be considered for a 24 hours (J+1) forecast over France?
Space-time scales One should get informations (observations, time evolutions, …) over a larger domain than the domain of interest. J+1 What is the size of the domain that should be considered for a 24 hours (J+1) forecast over France?
Space-time scales J+1 J+3? Same question for a 72 hours (J+3) forecast
Space-time scales For this range, one must have informations on a larger domain including polar and equatorial regions. J+1 J+1 J+3? J+3 Same question for a 72 hours (J+3) forecast
Space-time scales J+1 J+1 J+3? J+3 J+5? and for a 5 days (J+5) forecast?
Space-time scales For the medium and long range forecast the scales should be adapted to the forecast of suprasynoptic or large scale features So, one can work with a larger mesh and consequently describes only the large scale and suprasynoptic behaviours. J+1 J+1 J+3? J+3 J+5?
densité des observations de surface sur l’ensemble du globe Space-time scales Taking into account the concerned regions, the description of the initial state will be done with some lack of observation (density network).
Numerical models Gobal model are generally used from short range forecast up to long range forecast (including climate simulation)
Numerical models For specific domain of interest one can used « Limited Aera Model » allowing a finest description of the atmosphere evolution and consequently a forecast at smaller scales (compared to the global one)
Numerical models Limited Aera Model : The LAM must be coupled to a global model which regularly gives boundary conditions to the LAM during the whole integration (e.g. each 6 hours)
Numerical models Coupling zone fixing the coherency between the Global model and the LAM Limited Aera Model : The LAM must be coupled to a global model which regularly gives boundary conditions to the LAM during the whole integration (e.g. each 6 hours)
Numerical models Other solution : Stretched grid corresponding to a variable resolution on the domain (example from Arpège model)
Numerical models example from Arpège model Pole of interest The closer to the pole of interest, the better the resolution
Numerical models example from Arpège model in « ARPEGE » The spatial resolution over France is equivalent to a grid mesh of approximately 30 km. The spatial resolution is progressively relaxed until the antipode (near New-Zealand for « ARPEGE »).
Performances of numerical models The mean error of the forecast for a given parameter can be limited with the deviation to the climatology average Forecast error on the Europe domain Gépotential height at 500 hPa (altitude near 5500 m) 140 120 100 80 erreur en mètres 60 40 climatology 20 0 0 1 2 3 4 5 6 7 8 9 10 échéance (jour)
Performances of numerical models In meteorology, it can be also limited with the persistence forecast which is a usefull comparison Forecast error on the Europe domain Gépotential height at 500 hPa (altitude near 5500 m) 140 120 100 80 erreur en mètres 60 40 persistence climatology 20 0 0 1 2 3 4 5 6 7 8 9 10 échéance (jour)
Performances of numerical models To be usefull, the Model forecast must be in the aera delimited by the 2 curves Forecast error on the Europe domain Gépotential height at 500 hPa (altitude near 5500 m) 140 120 100 80 erreur en mètres 60 40 persistence climatology 20 0 0 1 2 3 4 5 6 7 8 9 10 échéance (jour)
Performances of numerical models The model error in 1975 is inside the aera Forecast error on the Europe domain Gépotential height 500 hPa (altitude near 5500 m) 140 120 100 80 erreur en mètres 60 40 1975 persistance climatology 20 0 0 1 2 3 4 5 6 7 8 9 10 échéance (jour)
Performances of numerical models One can see the continuous improvement during the 20 last years Forecast error on the Europe domain Gépotential height 500 hPa (altitude near 5500 m) 140 120 100 80 erreur en mètres 60 1980 40 1975 persistance climatology 20 0 0 1 2 3 4 5 6 7 8 9 10 échéance (jour)
Performances of numerical models This improvment is mainly due to observations and assimilation scheme, resolution gain link to computer evolution, better parametrisation, … Note the comparison with the 1975’score. Forecast error on the Europe domain Gépotential height 500 hPa (altitude near 5500 m) 140 120 100 80 erreur en mètres 60 1990 1980 40 1975 persistance climatology 20 0 0 1 2 3 4 5 6 7 8 9 10 échéance (jour)
Performances of numerical models At present time the mean error of the forecast is comparable for a 5 days forecast to those of a 2 days forecast in 1975. Forecast error on the Europe domain Gépotential height 500 hPa (altitude near 5500 m) 140 120 100 80 erreur en mètres 60 1998 1990 1980 40 1975 persistance climatology 20 0 0 1 2 3 4 5 6 7 8 9 10 échéance (jour)
Performances of numerical models Hopefully It still remains some place for new inprovments and increased performances Forecast error on the Europe domain Gépotential height at 500 hPa (altitude near 5500 m) 140 120 100 80 erreur en mètres 60 1998 1990 1980 40 1975 persistance climatology 20 0 0 1 2 3 4 5 6 7 8 9 10 échéance (jour)
Prospects • Improvements in numerical forecasting in the futur will come from: • - quality as well as quantity of observations (altitude, surface, satellite, ocean, soil properties, …). • - choice of some specific regions for observations for more accurate measurements («adaptative observation »). • Improvements in assimilation scheme (both from ocean and atmosphere perspective). • Improvements in parametrization (notably convection, surface exchange and boundary layer). • Improvements in simulating coupling processes.
Prospects Improvements in numerical forecasting in the futur will come from: - computing power(the more powerfull the computer, the better the discretisation and consequently the better the simulation of the evolution of the atmosphere). - methods used for verification of the forecasts. - methodsused to forecast (from nowcasting up to seasonnal forecast). …Without forgetting RESARCH