Download
1 / 18
180 likes | 302 Views
Bruce Hearn Department of Management, University of Leicester Veli Koc Centre for Environmental Policy, Imperial College London Jenifer Piesse Department of Management, King’s College London Department of Agricultural Economics, University of Stellenbosch Colin Thirtle

E N D
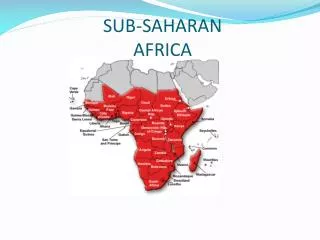
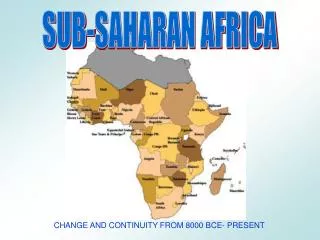
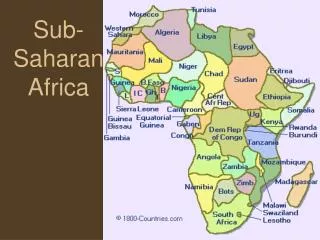
Bruce Hearn Department of Management, University of Leicester Veli Koc Centre for Environmental Policy, Imperial College London Jenifer Piesse Department of Management, King’s College London Department of Agricultural Economics, University of Stellenbosch Colin Thirtle Centre for Environmental Policy, Imperial College London Department of Agricultural Economics, University of Stellenbosch EUROPEAN ASSISTANCE TO AGRICULTURE IN SUB SAHARAN AFRICA
Outline and background • Follows OECD 2009 - database – http://stats.oecd.org/Index.aspx See Development/Aid Activities/Creditor Reporting System • They cover all agricultural aid from OECD DAC countries • We look specifically at EU countries aid to SSA only – overview • Historical background – theoretical framework - regional distribution – amounts and shares by donor country – aid effort – disbursements versus commitments – decomposition by purpose – broad sector aid including food aid and emergency assistance. • Top recipients – aid by purpose for Mozambique, Ghana and Uganda Key points • Bilateral aid to agriculture has halved since the mid 1980s • DAC aid to agriculture was 17% of total aid in the late 1980s – now only 6%
A Theoretical Framework • The basic concept is not difficult. We have a matrix with a column for each donor county i, where i =1….m, and a row for each recipient country j, where j = 1…n. The EU countries are all bilateral donors and if in addition we knew their contributions to multilateral agencies, summing the columns would give the country totals in terms of either commitments or disbursements. Similarly, most of the countries of SSA are recipients and summing the rows would give the total aid allocated to each country.
Aid to Agriculture as Share of Total DAC Agricultural Aid % by Donor Country
Agricultural Aid by Purpose Agricultural Aid Sub-Divided by Purpose for Germany Agricultural Aid Sub-Divided by Purpose for France Agricultural Aid Sub-Divided by Purpose for the UK Agricultural Aid Sub-Divided by Purpose for the US
Top Recipients of Aid to Agriculture only from all DAC countries (US$ mil)
Top Recipients by Donor • Belgium – DRC 6.45, Benin 3.15, Rwanda 2.93 • France – Madagascar 56.07, Cameroon 41.98, Burkina Faso 27.84 • UK – Malawi 6.93, Ghana 4.89, Rwanda 3.82 • US – Uganda 16.29, Mozambique 2.79, Kenya 10.25, Zambia 9.46, Malawi 5.45