Download
1 / 1

E N D
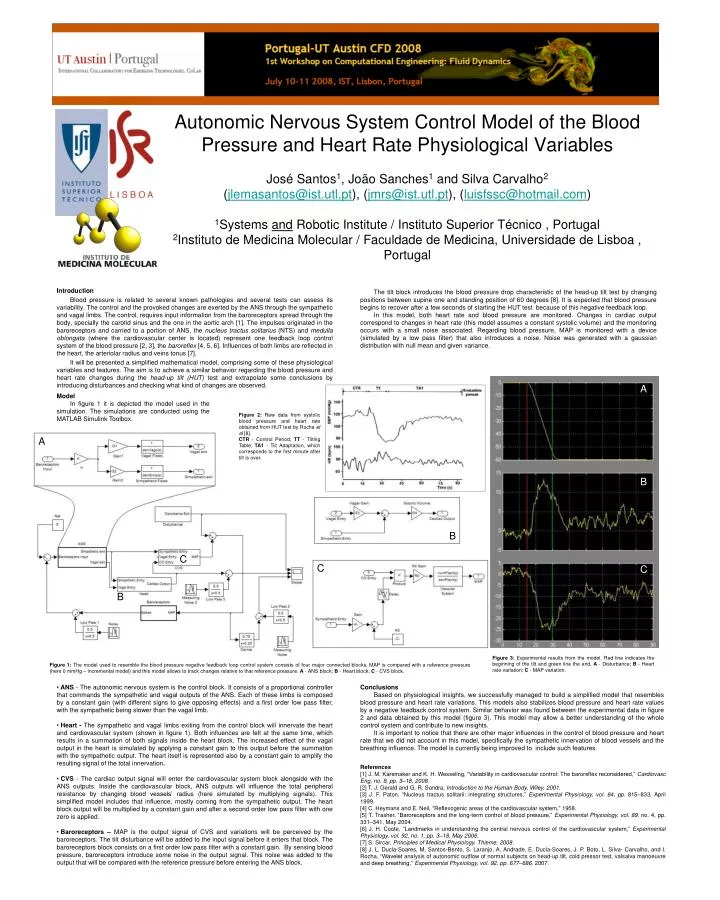
Autonomic Nervous System Control Model of the Blood Pressure and Heart Rate Physiological VariablesJosé Santos1, João Sanches1 and Silva Carvalho2(jlemasantos@ist.utl.pt), (jmrs@ist.utl.pt), (luisfssc@hotmail.com)1Systems and Robotic Institute / Instituto Superior Técnico , Portugal2Instituto de Medicina Molecular / Faculdade de Medicina, Universidade de Lisboa , Portugal The tilt block introduces the blood pressure drop characteristic of the head-up tilt test by changing positions between supine one and standing position of 60 degrees [8]. It is expected that blood pressure begins to recover after a few seconds of starting the HUT test because of this negative feedback loop. In this model, both heart rate and blood pressure are monitored. Changes in cardiac output correspond to changes in heart rate (this model assumes a constant systolic volume) and the monitoring occurs with a small noise associated. Regarding blood pressure, MAP is monitored with a device (simulated by a low pass filter) that also introduces a noise. Noise was generated with a gaussian distribution with null mean and given variance. A Model In figure 1 it is depicted the model used in the simulation. The simulations are conducted using the MATLAB Simulink Toolbox. Figure 2: Raw data from systolic blood pressure and heart rate obtained from HUT test by Rocha et al [8]. CTR - Control Period; TT - Tilting Table; TA1 - Tilt Adaptation, which corresponds to the first minute after tiltisover. A B Introduction Blood pressure is related to several known pathologies and several tests can assess its variability. The control and the provoked changes are exerted by the ANS through the sympathetic and vagal limbs. The control, requires input information from the baroreceptors spread through the body, specially the carotid sinus and the one in the aortic arch [1]. The impulses originated in the baroreceptors and carried to a portion of ANS, the nucleus tractussolitarius(NTS) and medulla oblongata (where the cardiovascular center is located) represent one feedback loop control system of the blood pressure [2, 3], the baroreflex [4, 5, 6]. Influences of both limbs are reflected in the heart, the arteriolar radius and veins tonus [7]. It will be presented a simplified mathematical model, comprising some of these physiological variables and features. The aim is to achieve a similar behavior regarding the blood pressure and heart rate changes during the head-up tilt (HUT) test and extrapolate some conclusions by introducing disturbances and checking what kind of changes are observed. B C C C B Figure 3: Experimental results from the model. Red line indicates the beginning of the tilt and green line the end. A - Disturbance; B - Heart rate variation; C - MAP variation. Figure 1: The model used to resemble the blood pressure negative feedback loop control system consists of four major connected blocks. MAP is compared with a reference pressure (here 0 mmHg – incremental model) and this model allows to track changes relative to that reference pressure. A -ANS block; B -Heart block; C -CVS block. • ANS - The autonomic nervous system is the control block. It consists of a proportional controller that commands the sympathetic and vagal outputs of the ANS. Each of these limbs is composed by a constant gain (with different signs to give opposing effects) and a first order low pass filter, with the sympathetic being slower than the vagal limb. • Heart - The sympathetic and vagal limbs exiting from the control block will innervate the heart and cardiovascular system (shown in figure 1). Both influences are felt at the same time, which results in a summation of both signals inside the heart block. The increased effect of the vagal output in the heart is simulated by applying a constant gain to this output before the summation with the sympathetic output. The heart itself is represented also by a constant gain to amplify the resulting signal of the total innervation. • CVS - The cardiac output signal will enter the cardiovascular system block alongside with the ANS outputs. Inside the cardiovascular block, ANS outputs will influence the total peripheral resistance by changing blood vessels’ radius (here simulated by multiplying signals). This simplified model includes that influence, mostly coming from the sympathetic output. The heart block output will be multiplied by a constant gain and after a second order low pass filter with one zero is applied. • Baroreceptors – MAP is the output signal of CVS and variations will be perceived by the baroreceptors. The tilt disturbance will be added to the input signal before it enters that block. The baroreceptors block consists on a first order low pass filter with a constant gain. By sensing blood pressure, baroreceptors introduce some noise in the output signal. This noise was added to the output that will be compared with the reference pressure before entering the ANS block. Conclusions Based on physiological insights, we successfully managed to build a simplified model that resembles blood pressure and heart rate variations. This models also stabilizes blood pressure and heart rate values by a negative feedback control system. Similar behavior was found between the experimental data in figure 2 and data obtained by this model (figure 3). This model may allow a better understanding of the whole control system and contribute to new insights. It is important to notice that there are other major influences in the control of blood pressure and heart rate that we did not account in this model, specifically the sympathetic innervation of blood vessels and the breathing influence. The model is currently being improved to include such features. References [1] J. M. Karemaker and K. H. Wesseling, “Variability in cardiovascular control: The baroreflex reconsidered,” CardiovascEng, no. 8, pp. 3–18, 2008. [2] T. J. Gerald and G. R. Sandra, Introduction to the Human Body. Wiley, 2001. [3] J. F. Paton, “Nucleustractussolitarii: integratingstructures,” Experimental Physiology, vol. 84, pp. 815–833, April 1999. [4] C. Heymans and E. Neil, “Reflexogenic areas of the cardiovascular system,” 1958. [5] T. Trasher, “Baroreceptors and the long-term control of blood pressure,” Experimental Physiology, vol. 89, no. 4, pp. 331–341, May 2004. [6] J. H. Coote, “Landmarks in understanding the central nervous control of the cardiovascular system,” Experimental Physiology, vol. 92, no. 1, pp. 3–18, May 2006. [7] S. Sircar, Principles of Medical Physiology. Thieme, 2008. [8] J. L. Ducla-Soares, M. Santos-Bento, S. Laranjo, A. Andrade, E. Ducla-Soares, J. P. Boto, L. Silva-Carvalho, and I. Rocha, “Wavelet analysis of autonomic outflow of normal subjects on head-up tilt, cold pressor test, valsalvamanoeuvre and deep breathing,” Experimental Physiology, vol. 92, pp. 677–686, 2007.