Download
1 / 32
320 likes | 465 Views
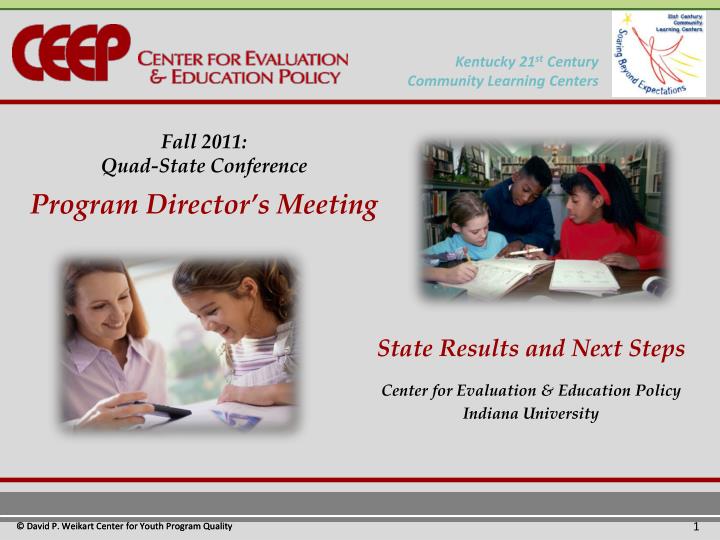
Kentucky 21 st Century Community Learning Centers. Fall 2011: Quad-State Conference Program Director’s Meeting. State Results and Next Steps Center for Evaluation & Education Policy Indiana University. Presentation Overview. Introduction 2009-2010 National Comparison Results

E N D
Kentucky 21st Century Community Learning Centers Fall 2011: Quad-State Conference Program Director’s Meeting State Results and Next Steps Center for Evaluation & Education Policy Indiana University
Presentation Overview Introduction 2009-2010 National Comparison Results Spring 2011 Site Visit Results Self Assessment and Next Steps
National Comparison: Attendance Regular Program Attendance: Kentucky vs. All States
National Comparison: Attendance Program Attendance: Special Services/ Program Classification Regular Student Attendees: Kentucky vs. All States
National Comparison: Grades English/Language Arts Grade Changes Among Regular Attendees During the 2009-2010 School Year: Kentucky vs. All States
National Comparison: Grades Math Grade Changes Among Regular Attendees During the 2009-2010 School Year: Kentucky vs. All States
Spring 2011 Site Visits Who? What? • 37 visits to Cycle 7 KY 21st CCLC programs • February through April 13, 2011 How? • Site coordinator interview • School day teacher interview • Standardized observation protocol for academic and enrichment activities
Site Visit Rating System Rating System: • 12 Items • (rated on a scale of 1 to 4) • 1 = Must Address and Improve • 2 = Some Progress Made • 3 = Satisfactory • 4 = Excellent • 48 Possible Points
Site Visits (CEEP) Purpose of 2011 Site Visits High School Programs Activities promote academic growth, remediation, and development Links to the regular school day Participants contribute ideas, make choices, and having positive experiences Establish partnerships and employ successful recruitment strategies Elementary/Middle School Programs Activities geared toward rigorous academic enrichment Links to the regular school day Individual support and opportunities for positive interactions for youth Relationships with schools, parents, and other community constituents
Elementary and Middle School Site Visit Results Focus Area 1 & 2: Activities Geared Toward Rigorous Academic Achievement Links to the School Day Focus Area 1 Focus Area 2
Elementary and Middle School Site Visit Results Focus Area 3 & 4: Opportunities for Individual Support and Positive Interactions Relationships with Schools, Parents, and Community Organizations Focus Area 3 Focus Area 4
High School Site Visit Results Activities Offered by Sites
High School Site Visit Results Focus Area 1 & 2: Activities Promote Academic Growth, Remediation, and Development Links to the School Day Focus Area 1 Focus Area 2
High School Site Visit Results Focus Area 3 & 4: Participants Contribute Ideas, Make Choices, and Have Positive Experiences Establishes Partnerships and Maintains Successful Recruitment Strategies Focus Area 3 Focus Area 4
Areas for Improvement • Supplemental Academic Enrichment (ES/MS Programs)– what activities does your program provide that are explicitly linked to grade-specific standards? • Academic Activities Tailored to Individual Student Needs (All programs) – how does your program identify students in need of academic support and use school data to plan programming?
Areas for Improvement (Cont’d) • Links to the School Day (All Programs)– how are the programs connected to the school-day content without being “more school after school?” • Credit Recovery (HS programs) – what activities does your program provide to give students the opportunity to engage in credit recovery and remediation?
Kentucky 21st CCLC 2011-2012 Action Plan
Implications for Kentucky’s 21st CCLC Program States must demonstrate that systems are in place for quality control and technical assistance. Programs must demonstrate that data are being used for continual improvement. 3. Programs must demonstrate increased ability to achieve results.
What is program quality? Program staff ??? outcomes students training youth program Another way to say it…What do we want to see in high quality youth programs?
YPQA: The Pyramid of Program Quality Plan Make choices Engagement Reflect Lead and mentor Be in small groups Partner with adults Interaction Experience belonging Encouragement Reframing conflict Supportive Environment Skill building Session flow Active engagement Welcoming atmosphere Psychological and emotional safety Safe Environment Program space and furniture Emergency procedures Healthy food and drinks Physically safe environment Youth Voice and Governance Professional Learning Community
What is the YPQA? 1. A validated instrument designed to assess the quality of youth programs and identify staff training needs. 2. A set of items that measures youth access to key developmental experiences. 3. A tool which produces scores that can be used for comparison and assessment of progress over time.
Kentucky 21st CLCCBuilding Capacity for a Quality Improvement System (QIS)
Quality Improvement System (QIS) • During the 2010-2011 school year . . . • A total of 134 KY 21st CCLC sites participated in the Quality Improvement System or self-assessment process • Represented roughly 80% of all program sites
Quality Improvement System (QIS) Self Assessment Data • A self assessment team (usually a program director and site coordinator) observed two program activities. • Activities observed included an academic enrichment and social/cultural enrichment activity. • Each site entered data from self assessment forms into the online system Scores Reporter. • Sites used a self-assessment form for younger youth or older youth, depending on the grade levels of students served.
Quality Improvement System (QIS) Self Assessment: Aggregate Data
Quality Improvement System (QIS) Self Assessment Data • Observation scores represent a snapshot – this has limitations and value. • These are aggregate scores from multiple observations. • The overall story is more important than the individual numbers. • What you do with the data matters most.
Quality Improvement System (QIS) External Assessment Data • External assessments were conducted for 17 sites during the spring 2011 site visits. • Sites in Cycle 7 who participated in the (QIS) during the 2009-2010 school year received an external visit. • Assessments were conducted to give sites the opportunity to compare self-assessment results to those conducted by someone external to the program.
Quality Improvement System (QIS) External Assessment Data • Keep in mind… • External assessment scores are always lower than self assessment scores. • Observation scores represent a snapshot – this has limitations and value. • The overall story is more important than the individual numbers. • What you do with the data matters most.
Quality Improvement System (QIS) Areas for Improvement: YPQA • Interaction—how does your program provide children with opportunities to practice leadership, develop a sense of belonging, participate in small groups, and interact positively with adults? • Engagement—what activities does your program provide to give children opportunities to set goals/make plans, reflect on activities, and make choices based on their interests?
2012 YPQA Kentucky 21st CCLCSelf-Assessment Process: Tentative Timeline
Quality Improvement System (QIS) What Happens Next? • Year 2011 Participants: • Required to enroll additional program sites in the 2012 QIS Cycle and train additional members of the Self Assessment Team for the new site. • Those who have not yet participated in the QIS • Required to enroll a Self-Assessment Team in the 2012 QIS Cycle. Team members typically include the Program Director and Site Coordinator.
Kentucky 21st Century Community Learning Centers Fall 2011: Quad-State Conference Program Director’s Meeting State Results and Next Steps Center for Evaluation & Education Policy Indiana University