Download
1 / 23
230 likes | 377 Views
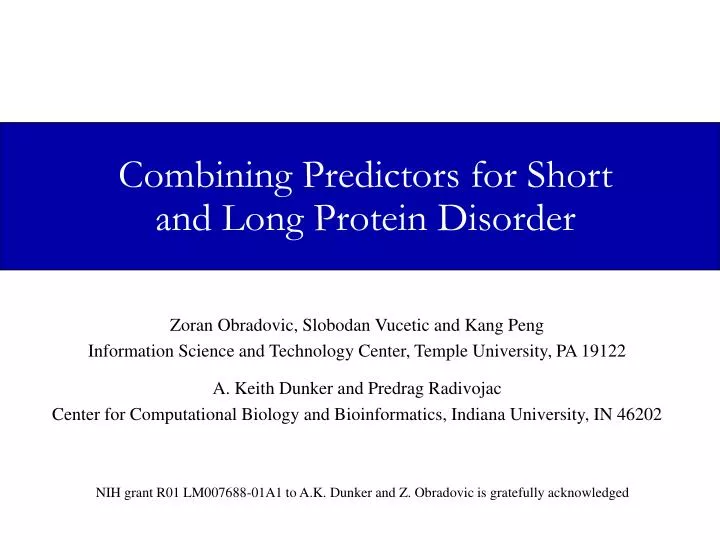
Combining Predictors for Short and Long Protein Disorder. Zoran Obradovic, Slobodan Vucetic and Kang Peng Information Science and Technology Center, Temple University, PA 19122 A. Keith Dunker and Predrag Radivojac

E N D
Combining Predictors for Short and Long Protein Disorder Zoran Obradovic, Slobodan Vucetic and Kang Peng Information Science and Technology Center, Temple University, PA 19122 A. Keith Dunker and Predrag Radivojac Center for Computational Biology and Bioinformatics, Indiana University, IN 46202 NIH grant R01 LM007688-01A1 to A.K. Dunker and Z. Obradovic is gratefully acknowledged
Introduction Protein Structure - under physiological condition, the amino acid sequence of a protein folds spontaneously into specific (native) three dimensional (3-D) structure or conformation hydrogen bond -strand 4 levels of protein structure hydrogen bond
> 1NLG:_ NADP-LINKED GLYCERALDEHYDE-3-PHOSPHATE EKKIRVAINGFGRIGRNFLRCWHGRQNTLLDVVAINDSGGVKQASHLLKYDSTLGTFAAD VKIVDDSHISVDGKQIKIVSSRDPLQLPWKEMNIDLVIEGTGVFIDKVGAGKHIQAGASK VLITAPAKDKDIPTFVVGVNEGDYKHEYPIISNASCTTNCLAPFVKVLEQKFGIVKGTMT TTHSYTGDQRLLDASHRDLRRARAAALNIVPTTTGAAKAVSLVLPSLKGKLNGIALRVPT PTVSVVDLVVQVEKKTFAEEVNAAFREAANGPMKGVLHVEDAPLVSIDFKCTDQSTSIDA SLTMVMGDDMVKVVAWYDNEWGYSQRVVDLAEVTAKKWVA Amino Acid Sequence 3-D Structure Function:Gene Transfer Biological Function Importance of Protein Structure The “central dogma” – amino acid sequence determine protein structure, and protein structure determine its biological function Thus, it is important to know a protein’s structure to understand its function and other biological properties
Protein Structure Prediction • The sequence-structure gap • Current experimental structure determination techniques, e.g. X-ray diffraction and NMR spectroscopy, are still slow, expensive and have their limitations • As a result, there are less than 30,000 experimental protein structures, compared to more than 1.6 million known protein sequences • Protein structure prediction – predicting protein structures from amino acid sequences using computational methods • Aspects of protein structure prediction • 1D – secondary structures, solvent accessibility, transmembrane helices, signal peptides/cleavage sites, coiled coils, disordered regions • 2D – inter-residue contacts, inter-strand contacts • 3D – individual atom coordinates in the tertiary structure (the ultimate goal)
The CASP Experiments • Critical Assessment of Techniques for Protein Structure Prediction • The primary goal • To obtain an in-depth and objective assessment of current methods for predicting protein structure from amino acid sequence • The procedure • Proteins with “soon to be solved” structures are selected as prediction targets, and their amino acid sequences are made available • Prediction teams submit their prediction models before the experimental structures are released • Prediction models are compared to experimental structures for detailed evaluation by independent assessors CASP Website: http://predictioncenter.llnl.gov/
Prediction Categories in CASP6 • Tertiary structure (3-D coordinates for individual atoms) prediction • Comparative/Homology modeling • Fold recognition • New fold modeling • Disordered region prediction (since CASP5) • Domain boundary prediction (new) • Residue-residue contact prediction (new) • Secondary structure prediction was excluded in CASP6 In CASP6 there were 20 groups participated in Disordered Region prediction, while only 6 groups in CASP5
Kissinger et al, 1995 Disordered Region (DR) • Part of a protein or a whole protein that does NOT have stable 3D structure in its native state • Perform important biological functions • Have distinct sequence properties • Evolve faster than ordered regions • Common in nature Other definitions of disordered region • Missing coordinates(used by CASP) • High B-factors • Random coils • NOn-Regular Secondary Structure (NORS)
K Q L L W C Y L A A M A H Q F G A G K L K C T S A T T W Q G Input Window of length Win • Attributes derived from the local window • 20 AA frequencies • K2-entropy (sequence complexity) • Flexibility • Hydropathy • more … Class label 0/1: disordered / ordered Amino Acid Sequence One example for each sequence position (residue) Prediction of Disordered Regions
Long DR Predictors on Short DR • Disordered regions can be divided into 2 groups according to their lengths • short DRs– 30 consecutive residues or shorter • long DRs– longer than 30 consecutive residues • Our previous disorder predictors were specific to long DRs • Predictors – VL-XT, VL2, VL3, VL3H, VL3P, VL3B • Accuracies – 70% (VL-XT) ~ 85% (VL3P) • They were less successful on short DRs, as shown in CASP5 • 25~66% per-residue accuracy on short DRs • 75~95% per-residue accuracy on long DRs • Possible reasons • The window lengths for attribute construction and post-filtering were optimized for long DRs • Training data did NOT include any short DRs • Short DRs are different from long DRs in terms of amino acid compositions, flexibility index, hydropathy and net charge
Radivojac et al., Protein Science, 2004 Amino Acid Compositions of Short DRs Amino acid frequency difference from Globular-3D Consequence – a predictor specialized for short disordered regions is necessary
Meta Predictor wL wS Long Disorder Predictor (>30aa) OL Input Final Prediction OS Short Disorder Predictor (30aa) Our Approach in CASP6 Idea – two specialized predictors for long and short disordered regions, and a meta predictorto estimate which specialized predictor is more suitable for current input In CASP5, we used only Long Disorder Predictor component
The Training Dataset a) LONG and ORDER – training data for VL3 predictors (Z. Obradovic, K. Peng, S. Vucetic, P. Radivojac, C. J. Brown, A. K. Dunker, Proteins, 53 (S6): 566-572, 2003; K. Peng, S. Vucetic, P. Radivojac, C. J. Brown, A. K. Dunker, Z. Obradovic, Journal of Bioinformatics and Computational Biology, in press) b) ORDER – training data for a B-factor predictor and used in a study of flexibility index (P. Radivojac, Z. Obradovic, D. K. Smith, G. Zhu, S. Vucetic, C. J. Brown, J. D. Lawson, A. K. Dunker, Protein Science, 13 (1):71-80, 2004; D. K. Smith, P. Radivojac, Z. Obradovic, A. K. Dunker, G. Zhu, Protein Science, 12 (5):1060-1072, 2003) c) SHORT – training data for a short disorder predictor (Radivojac et al., Protein Science, 13 (1):71-80, 2004) d) XRAY – a non-redundant set of PDB chains released between June 2003 and May 2004 e) TOTAL - the merged sequences are non-redundant with less than 50% identity
Specialized Disorder Predictors Optimized for long and short disordered regions, respectively a) Length of input window for attribute construction b) Length of output window for post-filtering c) Out-of-sample per-chain accuracies were estimated by 1) randomly split the 1335 sequences into 75%:25%, 2) the first part for training and the second for testing, 3) repeat steps 1 and 2 for 30 times and average the accuracies
Meta Predictor OG 1-OG Long Disorder Predictor (>30aa) OL Input The final output O = OL* OG + OS * (1 - OG) OS Short Disorder Predictor (30aa) The Prediction Process • For each sequence position (residue) • The three predictors construct attributes and output OL, OS and OG • The final output is calculated as O = OL * OG+ OS * (1 – OG) • If O > 0.5, predict disorder Otherwise, predictorder
Example: Ordered Region Ordered Region A Short Disordered Region (8aa) GKKGAVAEDGDELRTEPEAKKSKTAAKKNDKEAAGEGPALYEDPPDHKTS Sequence: ooooooooooooooooooooDDDDDDDDoooooooooooooooooooooo Disorder labels: uuuuuuuuuuuuuu00000000000000000000uuuuuuuuuuuuuuuu Class labels: Input Window (Length Win) Current Residue The input window (of length Win =61) centered at current residue must overlap with more than half of a disordered region Training the Meta Predictor • The meta predictor was then trained as a 2-class classifier (short disorder vs. long disorder) • Constructing labeled dataset for training of meta predictor • Used same attributes as for the short disorder predictor • Residues from long DRs and their flanking regions were labeled as class 1 • Residues from short DRs (3aa) and their flanking regions were labeled as class 0 • The remaining residues were discarded (u)
CASP6 Targets • 63 targets with 3-D coordinates information available, with 90 disordered regions and 90 ordered regions
Prediction Accuracy (a) per-region accuracy (b) per-residue accuracy • VL2 (CASP6 model-3) – a previously developed long disorder predictor (S. Vucetic, C.J. Brown, A.K. Dunker and Z. Obradovic, Proteins: Structure, Function and Genetics, 52:573-584, 2003) • VL3E(CASP6 model-2) – a previously developed long disorder predictor (Z. Obradovic, K. Peng, S. Vucetic, P. Radivojac, C. J. Brown, A. K. Dunker, Proteins, 53 (S6): 566-572, 2003; K. Peng, S. Vucetic, P. Radivojac, C. J. Brown, A. K. Dunker, Z. Obradovic, Journal of Bioinformatics and Computational Biology, in press) • NEW (CASP6 model-1) – the combined predictor • NEW/short – the specialized predictor for short disordered regions (30aa) • NEW/long – the specialized predictor for long disordered regions (>30aa)
Prediction on Long Disordered Regions (a) Prediction by component predictors (b) Comparison to previous predictors Notes: (1) red segments indicate disordered regions (of missing coordinates), (2) The threshold for predicting disorder is 0.5
Prediction on Short Disordered Regions Notes: (1) red segments indicate disordered regions (of missing coordinates), (2) The threshold for predicting disorder is 0.5 In both targets, all short DRs were identified, but with considerable amount of false positives. More detailed analysis shows that the new predictor tend to over-predict at N- and C- termini
Correlation with High B-factor Regions Notes: (1) red segments indicate disordered regions (of missing coordinates), (2) The threshold for predicting disorder is 0.5, (3) no B-factor data for disordered regions
Conclusion by CASP6 Assessor “Group 193 is best on all measures, on both no-density segments and B-factors, and is significantly better than next 3 groups, 096, 003, 347 on no-density segments, who are about the same as each other. Groups 3, 347, and 472 are good at B-factors” Group IDs: • 193 ISTZORAN (Zoran Obradovic, Temple University) • 096 CaspIta (Tosatto et al., Univ. of Padova) • 003 Jones UCL (David Jones, University College London) • 347 DRIP PRED (server from Bob MacCallum, Stockholm) • 472 Softberry (good at B-factor correlation) Assessor’s report is available at CASP6 website: http://predictioncenter.llnl.gov/casp6/meeting/presentations/DR_assessment_RD.pdf
Future Directions • The length threshold 30 for dividing DRs into long and short is artificial and may not be the best choice • A better method for partitioning the DRs into more homogenous length groups (maybe more than 2) • The new predictor produced considerable amount of false positives, especially at the N- and C- terminals. • Build predictors specific to terminal and internal regions, and combine them (a similar approach to VL-XT) • The dataset contains noises, i.e. mislabeling, since not all missing coordinate regions may not necessarily be due to disorder
The End Thank You!!