Download
1 / 48
480 likes | 629 Views
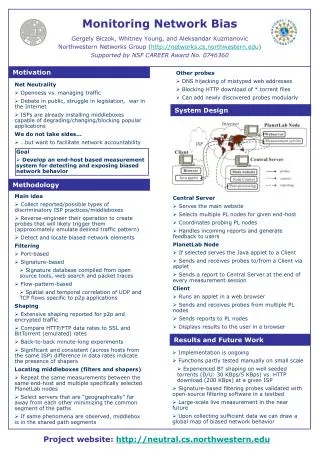
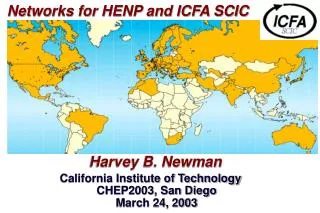
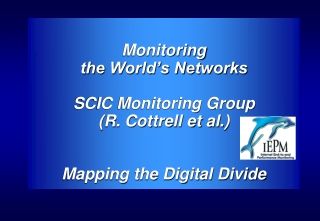
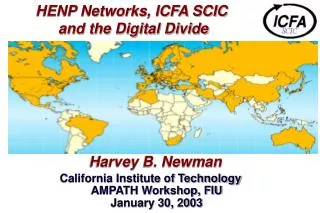
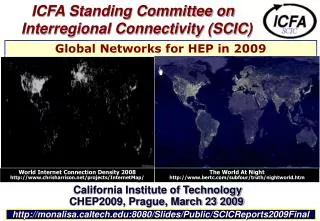
ICFA/SCIC Network Monitoring. Prepared by Les Cottrell, SLAC, for the Digital Divide and HEPGrid Workshop UERJ – Rio de Janeiro, Brazil Feb 16 – 20, 2004 www.slac.stanford.edu/grp/scs/net/talk03/icfa-feb04.ppt.

E N D
ICFA/SCIC Network Monitoring Prepared by Les Cottrell, SLAC, for the Digital Divide and HEPGrid Workshop UERJ – Rio de Janeiro, Brazil Feb 16 – 20, 2004 www.slac.stanford.edu/grp/scs/net/talk03/icfa-feb04.ppt Partially funded by DOE/MICS Field Work Proposal on Internet End-to-end Performance Monitoring (IEPM), also supported by IUPAP
Outline • What is PingER • World Internet performance trends • Regions and Digital Divide • Examples: • Africa, Latin America, Brazil, Pakistan • Compare with Development Index • Challenges • Collaborations & Funding • Futures for PingER • Summary of state of world Internet performance
Methodology • Use ubiquitous ping • Each 30 minutes from monitoring site to target : • 1 ping to prime caches • by default send11x100Byte pkts followed by 10x1000Byte pkts • Low network impact good for developing world • Record loss & RTT, (+ reorders, duplicates) • Derive throughput, jitter, unreachability …
Architecture • Hierarchical vs. full mesh WWW HTTP Ping SLAC Reports & Data Archive FNAL Archive Monitoring Monitoring Monitoring Cache Monitoring Remote 1 monitor host remote host pair Remote Remote Remote
PingER Benefits • Aimed at: end-user (net-admin & sophisticated user), planners • Measures analyzes & reports round-trip times, losses, availability, throughput ... • Uses ubiquitous ping, no special host, or software to install/configure at remote sites, no passwords or credentials needed • Low impact on network << 100bits/s, important for many DD sites • Covers 100+ countries (> 90% of Internet connected population) • Provides quantitative historical (> 8yrs) and near real-time information • Aggregate by regions, affiliations etc. • How bad is performance to various regions, rank countries? • Trends: who is catching up, falling behind, is progress being made? • Compare vs. economic, development indicators etc. • Use for trouble shooting setting expectations, identify needed upgrades, choosing a provider, presenting to policy makers, funding bodies Monitoring site vs. Remote sites screen shot
Countries Monitored • Monitoring hosts • 33 hosts • 13 Countries • Remote hosts • >100 countries • 560 sites • 880 hosts • 3700 pairs Need > 1 host to reduce anomalies Used to monitor Only 1 host
World Trends • Increase in sites with Good (<1%) loss • 25% increase in sites monitored • Big focus on Africa 4=>19 countries • Silk Road
Loss to world from US Loss Rate < 0.1 to 1 % 1 to 2.5 % 2.5 to 5 % 5 to 12 % > 12 % 2001 Dec-2003 • In 2001 <20% of the world’s population had Good or Acceptable Loss performance • BUT by December 2003It had improved to 77%
Trends S.E. Europe, Russia: catching up Latin Am., Mid East, China: keeping up India, Africa: falling behind Derived throughput~MSS/(RTT*sqrt(loss)) Africa shown for only Uganda seen from SLAC, since adding new countries with very different throughputs distorts result
Regions Monitored • Recent added NIIT PK as monitoring site • White = no host monitored in country • Colors indicate regions • Also have affinity groups (VOs), e.g. AMPATH, Silk Road, CMS, XIWT and can select multiple groups
Digital Divide Regions • Design regions • to match well known world regions and • to have similar connectivity within region • Developed: • U.S.+Canada, Japan+Taiwan+Singapore+Korea, Australia+NZ, Europe (excl. SE Europe, Russia) • Developing (Digital Divide): • Africa, S. America, C. America, C. Asia, China, S. Asia, Caucasus, M. East, SE Europe, Russia Israel has much better connectivity than neighbors in Mid East so distorts Mid East results, move to Europe?! Greece is part of Europe, should it be part of S. E. Europe, choice varies with time…
Current State – Aug ‘03 thruput ~ MSS / (RTT * sqrt(loss)) • Within region performance better • E.g. Ca|EDU|GOV-NA, Hu-SE Eu, Eu-Eu, Jp-E Asia, Au-Au, Ru-Ru|Baltics • Africa, Caucasus, Central & S. Asia all bad Acceptable > 500kbits/s, < 1000kbits/s Bad < 200kbits/s < DSL Poor > 200, < 500kbits/s Good > 1000kbits/s
Examples of Use • Africa • L. America • Brazil • Pakistan: • NIIT & NCP
To Pakistan performance Routes: ESnet (hops 3-8) - DC ATT (9-21) - Karachi Karachi Nb big differences between sites NIIT/Rawalpindi Routes: ESnet (hops 3-6) - SNV SINGTEL (7-12) - Karachi Pakistan Telecom Karachi Rawalpindi Loss % Islamabad RTT ms Routes: ESnet (hops 3-6) - SNV SINGTEL (7-12) - Karachi Pakistan Telecom Karachi Lahore Lahore
From Pakistan Performance Route: Pakistan Telecom (2-5) Rawalpindi, Karachi SingTel (6-10) ESnet (11-14) - PAIX NIIT to SLAC Route: Pakistan Telecom (2-5) Rawalpindi, Karachi Concert (6-9) London DataTAG (11-12) .de NIIT to CERN Note similarities, probably due to common bottleneck, probably in Pakistan
NIIT performance from U.S. (SLAC) Preliminary results, started measurements end Dec 2003. Nb. Heavy losses during congested day-times Avg daily: loss~1-2%, RTT~320ms Ping RTT & Loss Bandwidth measurements using packet pair dispersion & TCP abing (pkt-pair dispersion):Average To NIIT: ~350Kbits/s From NIIT: ~365 Kbits/s Iperf/TCP (with SLAC): Average: To NIIT: ~320Kbits/s From NIIT: ~330Kbits/s Iperf/TCP (with CERN): Average: To NIIT: ~270Kbits/s From NIIT: ~300Kbits/s Can also derive throughput (assuming standard TCP) from RTT & loss (monthly) using: BW~1.2*S(1460B)/(RTT*sqrt(loss) ~ 260Kbits/s (SLAC to NIIT) ~ 630Kbits/s (NIIT to SLAC | CERN) Nominal path bottleneck capacity 1Mbits/s
Available Bandwidth • Use available bandwidth estimator (abing) • Uses packet pair dispersion • Low impact, 40*1450Byte packets • Repeat once/minute • Client at SLAC, mirror/server at NIIT • red line is the cross-traffic • deduced by looking at the variation over and above the minimum packet pair separation, the • green line is the bandwidth capacity of current bottleneck • deduced from the minmum packet separation • blue line is available bandwidth = capacity-cross-traffic.
To NCP Pakistan • Cannot use PingER to measure to ncp.edu.pk • Pings blocked at FLAG router (62.216.145.154, AS15412) on way to Comsats (Pakistani ISP) • Working with NCP to try and resolve • Trying to contact FLAG • Using abing instead ~ 2MBits/s, but link is 384Kbps Looking for discrepancy
Within Pakistan • SLAC – Karachi U: • ESnet (hops 3-8) – DC ATT (9-21) – Karachi • SLAC – NIIT RawalpindiI: • ESnet (hops 3-6) – SNV, SINGTEL (7-12) – Karachi, Pakistan Telecom Karachi-Rawalpindi • SLAC - U Lahore, similar to NIIT • SLAC – NSC: • ESnet (hops 1-6), C&W (7-11) Santa Clara – NY, FLAG (12-16) NY – London – Karlsruhe, Comsats • NIIT – NSC (Rawalpindi – Islamabad) few miles apart, • No peering in Pakistan, can this be changed? • Route goes via England: • PIE (hops 1-5), Concert (6-9)- London, FLAG (10-14) London – Karachi, Comsats (15) • Takes longer than to SLAC
Pakistan Conclusions • Big performance differences to sites, depend on ISP (at least 3 ISPs seen for Pakistan A&R sites) • To NIIT: • get about 300Kbps, possibly 380Kbps at best • Suspicious that the bottleneck is not 1Mbps but rather closer to 400Kbps. • The bottleneck appears to be in Pakistan • There is often congestion (packet loss & extended RTTs) during busy periods each weekday • Video will probably be sensitive to packet loss, so it may depend on the time of day • H.323 (typically needs 384Kbps + 64Kbps), would appear to be marginal at best at any time. • No peering Pakistan between NIIT and NSC
Technology Achievement Index (TAI) • TAI captures how well a country is creating and diffusing technology and building a human skills base. • TAI from UNDP hdr.undp.org/reports/global/2001/en/pdf/techindex.pdf TAI top 12 Finland 0.744 US 0.733 Sweden 0.703 Japan 0.698 Korea Rep. of 0.666 Netherlands 0.630 UK 0.606 Canada 0.589 Australia 0.587 Singapore 0.585 Germany 0.583 Norway 0.579 US & Canada off-scale
Challenges • Effort: • Negligible for remote hosts • Monitoring host: < 1 day to install and configure, occasional updates to remote host tables and problem response • Archive host: 20% FTE, code stable, could do with upgrade, contact monitoring sites whose data is inaccessible • Analysis: your decision, usually for long term details download & use Excel • Trouble-shooting: • usually re-active, user reports, then look at PingER data • have played with automating alerts, data will/is available via web services • Ping blocking • Complete block easy to ID, then contact site to try and by-pass, can be frustrating for 3rd world • Partial blocks trickier, compare with synack • Derived throughputs poor for well connected sites (<0.1% loss) • Funding • “Unfortunately, network management research has historically been very under-funded, because it is difficult to get funding bodies to recognize this as legitimate networking research.” Sally Floyd, IAB Concerns & Recommendations Regarding Internet Research & Evolution. • http://www.ietf.org/internet-drafts/draft-iab-research-funding-00.txt
Collaborations & Funding • 35+ monitoring sites in 13 countries • Plan to add ICTP Trieste if funded • Other projects used toolkit, e.g. XIWT, PPCNG/EDG, IAEA … • SLAC with help from FNAL • Digital Divide collaboration (MOU) with ICTP, Trieste • eJDS • We are looking for a IDRC grant for eJDS and PingER • Need funding for coming year (DoE funding ended): • Tasks: • (0.5 FTE) ongoing maintain data collection, explain needs, reopen connections, open firewall blocks, find replacement hosts, make limited special analyses, prepare & make presentations, respond to questions • (+ 0.5 FTE) extend the code for new environment (more countries, more data collections), fix known non-critical bugs, improve visualization, automate some of reports generated by hand today, find new country site contacts, add route histories and visualization, automate alarms, detect rate limiting earlier, update web site for better navigation, add more DD monitoring sites/countries, improve code portability, understand regions better • Also looking for small grants for helpers in developing countries • ICFA: show importance to policy makers, funding agencies, identify sympathetic contacts at agencies, get support
Futures • Get >= 2 hosts/country • Better/quicker detection of rate limiting • Have 4 students at GATech rewriting parts of PingER to improve (reduce effort required for) day to day management and improve portability • Submitting a proposal to IDRC for monitoring Africa and adding a measurement host in Nigeria • Need better automated tools to produce graphs like in this presentation.
Summary • Performance from U.S. & Europe is improving all over • Performance to developed countries are orders of magnitude better than to developing countries • Poorer regions 5-10 years behind • Poorest regions Africa, Caucasus, Central & S. Asia • Some regions are: • catching up (SE Europe, Russia), • keeping up (Latin America, Mid East, China), • falling further behind (e.g. India, Africa)
More Information • PingER: • www-iepm.slac.stanford.edu/pinger/ • MonaLisa • monalisa.cacr.caltech.edu/ • GGF/NMWG • www-didc.lbl.gov/NMWG/ • ICFA/SCIC Network Monitoring report, Jan03 • www.slac.stanford.edu/xorg/icfa/icfa-net-paper-dec02 • Monitoring the Digital Divide, CHEP03 paper • arxiv.org/ftp/physics/papers/0305/0305016.pdf • Human Development Index • www.undp.org/hdr2003/pdf/hdr03_backmatter_2.pdf • Network Readiness Index • www.weforum.org/site/homepublic.nsf/Content/Initiatives+subhome
Visualization Keep it simple, enable user to do their own by making data available • Tables • Time series (www-iepm.slac.stanford.edu/cgi-wrap/pingtable.pl): • select metric (loss, RTT etc.), time ticks, packet size, aggregations from/to, etc. • Color code numbers, provide sort, drill down to graphs, download data (TSV), statistical summaries • Monitoring site vs. Remote sites (www-iepm.slac.stanford.edu/cgi-wrap/table.pl): • Select metric, region aggregations • Drill down to time series, download data • Graphs • Select source(s)/destination(s), metric, time window, SQL selects, graph type
Publish information • www.slac.stanford.edu/cgi-wrap/pingtable.pl => tabular reports, also download data • Data accessible from MonaLisa • Implementing web services access prototype • Includes: PingER, IEPM-BE, RIPE-tt, I2 E2Epi OWAMP • Use GGF/NMWG schema/profile, e.g. • path.delay.roundTrip #!/usr/bin/perl use SOAP::Lite; my $characteristic = SOAP::Lite -> service(‘http://www-iepm.slac.stanford.edu/tools/soap/wsdl/profile_06.wsdl') -> pathDelayOneWay("tt81.ripe.net:tt28.ripe.net”); print $characteristic->{NetworkTestTool}->{toolName},"\n"; print $characteristic->{NetworkPathDelayStatistics}->{value},"\n";
Recent additions • Added hosts in Albania, Macedonia, Serbia/Montenegro, Belarus, Turkey, Armenia, Mexico, Cuba, Azerbaijan, Tajikistan, Turkeministan, Kyrgyzstan, Phillippines & Namibia • Contacts • Working with contacts in Vietnam, and Tunisia • Looking for contacts in Kenya, Algeria, Malaysia, Thailand, Indonesia and Uganda • Working with Iran site to set up monitor host • Increased hosts monitored from CERN to give better European view • Now monitoring 60 countries
Usage Examples To North America Ten-155 became operational on December 11. Smurf Filters installed on NORDUnet’s US connection. Upgrades & ping filtering To Western Europe Peering problems
Usage Examples • Selecting ISPs for DSL/Cable services for home users • Monitor accessibility of routers etc. from site • Long term and changes • Trouble shooting • Identifying problem reported is probably network related • Identify when it started and if still happening or fixed • Look for patterns: • Step functions • Periodic behavior, e.g. due to congestion • Multiple sites with simultaneous problems, e.g. common problem link/router … • Provide quantitative information to ISPs Identify need to upgrade and effects • BW increase by factor 300 • Multiple sites track • Xmas & summer holiday
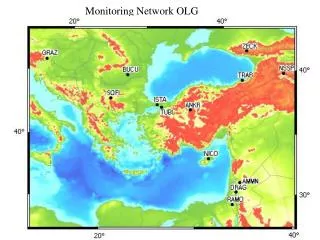
Rate Limiting At any given time, about 5% of monitored hosts are doing this, most in developing countries. Recently (August 2003) seen an increase in ping rate limiting RTT Loss RTT Loss boromir.nask.waw.pl boromir.nask.waw.pl 2 hosts at same site see sudden step-like increase in loss from < 1% to 20-30% at similar time gollum.nask.pl gollum.nask.pl Loss Loss RTT RTT www.pol34.pl Another host in Poland sees no problems, i.e. helps to have another nearby host www.pol34.pl Similar effects for Greek (uoa.gr), Bulgarian (acad.bg), Kazakhstan (president.kz), Moldovan (asm.md) and Turkish (metud.edu.tr) sites If no step function or nearby host may not notice, so also compare synack vs ping Can ping routers along path to see where onset occurs
Rate Limiting Moldova RTT Loss lises.asm.md cni.md Bulgaria Moldova
Russia • Russian losses improved by factor 5 in last 2 years, due to multiple upgrades • E.g. Upgrade to KEK-BINP link from 128kbps to 512kbps, May ’02: improved from few % loss to ~0.1% loss
Africa • Hosts in: Ife-Ife/Nigeria, Accra/Ghana, Kampala/Uganda, Windhoek/Namibia, UCT/ZA, Johannesburg/ZA, Musselbay/ZA • Carriers: • GH uses UUNET/Satworks, NA uses UUNET/xantic, NG uses TELIANET/NewSkies, UG uses Level(3)/globalconnex • ZA varies from site to site: UUNET/ALTERNET, C&W Telecom S. Africa, CAIS telcom S. Africa • UG, NA, NG, GH use satellites (> 600ms) • ZA uses landlines
Africa RTT • Monitored from N. America & Europe • Depends on remote site (not monitoring site) • Satellite for all except S. Africa • Ghana problems
West Africa • Ghana very poor performance • Sudden increase on August 18th • Not rate limiting according to synack • Sometimes get down to a few % • Route ESnet-UUNET/ALTER.NET • Losses appear on last 2 hops in Ghana • Nigeria better • Route via TELIANET/newskies
Africa Derived Throughput • S. Africa (UCT) best, followed by Uganda, Nigeria and Ghana • Throughput to Nigeria site == home DSL/cable • Throughput to Ghana site === modem dialup
Europe NREN Core Network Size (Mbps-km) 2000 Leading 10M Belgium 2001 Advanced 1M Netherlands In transition 100K Lagging 10K 1K Turkey 100 Source: From slide prepared by Harvey Newman, presented by David Williams ICFA/SCIC talk on Serenate report. Data from the TERENA Compendium Derived throughput~MSS/(RTT*sqrt(loss))
Loss Comparisons with Development (UNDP) Weak correlation with Human Development or GDP Even weaker with education & literacy
Digital Access Index • DAI (from ITU 2002) includes: • Availability of infrastructure • Affordability of access • Education level • Quality of ICT services • Internet usage Top DAI countries Good positive correlation between throughput and DAI Care needed with shorter RTTs
Network Readiness • NRI from Center for International Development, Harvard U. http://www.cid.harvard.edu/cr/pdf/gitrr2002_ch02.pdf NRI Top 14 Finland 5.92 US 5.79 Singapore 5.74 Sweden 5.58 Iceland 5.51 Canada 5.44 UK 5.35 Denmark 5.33 Taiwan 5.31 Germany 5.29 Netherlands 5.28 Israel 5.22 Switzerland 5.18 Korea 5.10 A&R focus Internet for all focus • Using derived throughput ~ MSS / (RTT * sqrt(loss)) • Fit to exponential is better