Download
1 / 9
90 likes | 339 Views
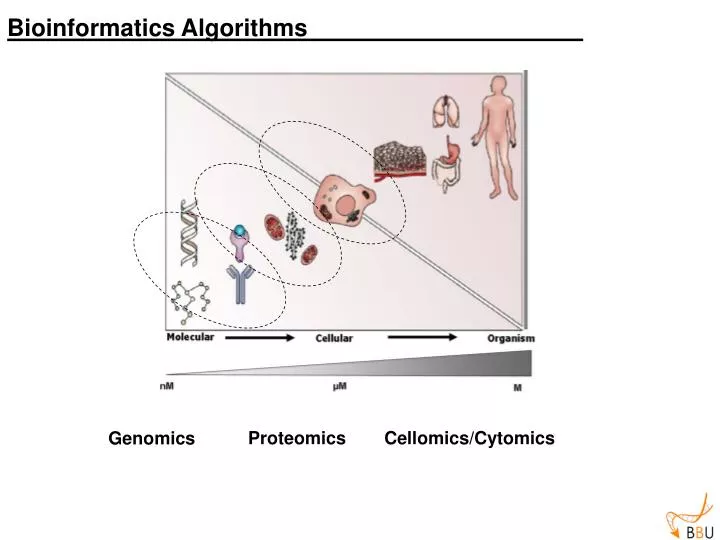
Genomics. Proteomics. Cellomics/Cytomics. Bioinformatics Algorithms . Bioinformatics Algorithms . Sequence analysis Phylogeny Patterns recognition Structure prediction Expression analysis Image analysis. Associative arrays (hashes).

E N D
Genomics Proteomics Cellomics/Cytomics Bioinformatics Algorithms
Bioinformatics Algorithms • Sequence analysis • Phylogeny • Patterns recognition • Structure prediction • Expression analysis • Image analysis
Associative arrays (hashes) Associative arrays are similar to normal arrays, with one important difference. Instead of using numbers to index each element in an array, you can use more meaningful strings. Associative arrays (“hash variables”) are preceded by the percent sign (%). %favourite_cats = ( mary, "Fluffy", jim, "Tibby", fred, "Lucky" ); $cat{jim} = "Felix"; %colour_purple = ( r => 255, g => 0, b => 255 ); %product = ("Super Widget" => 39.99, "Wonder Widget" => 49.99, "Mega Widget" => 69.99 ); $product{"Super Widget"} = 29.99; $item = "Super Widget"; $price = 39.99; $product{$item} = $price; print $product{"Super Widget"}; 39.99
Building a scoring matrix • Collect all known sequences for the region of interest. • • Align all sequences (using multiple sequence alignment). • • Compute the frequency of each nucleotide in each position (PSPM). • • Incorporate background frequency for each nucleotide (PSSM). • Score the query sequence with the PSSM.
Normalized with background probability Prior probability N : total number of sequences (15 in this example) ni,j:number of times nucleotide ‘i’ was observed in position ‘j’ of the alignment fi,j :ni,j/N - frequency of letter ‘i’ at position ‘j’ pi:a priori probability of letter ‘i’ in this example pA = 0.3, pT = 0.3, pG = 0.2, pC = 0.2 (overall frequency of the letters within Drosophila melanogaster genome) Positive weight i,j means that frequency of letter i at position j of the alignment is higher then a priori probability of this letter.
Shapiro Senapathy Scoring Schema RNA splice junctions of different classes of eukaryotes: sequence statistics and functional implications in gene expression. (Nucleic Acids Res. 1987 Sep 11;15(17):7155-74 ) Exon Intron Exon 3’ 5’ Score = 100 (t-mint) / (maxt-mint) maxt = 595 mint = 47
AAGTGAGT Scoring a sequence t = 58+10+100+100+39+71+84+47 = 509 mint = 47 & maxt = 595 Score = 100(509-47)/(595-47) = 84.3