Download
1 / 1
10 likes | 67 Views
Vulnerability Maps for Natural Disaster Risk Analysis and Mitigation Planning for Coastal Communities. ]. ABSTRACT

E N D
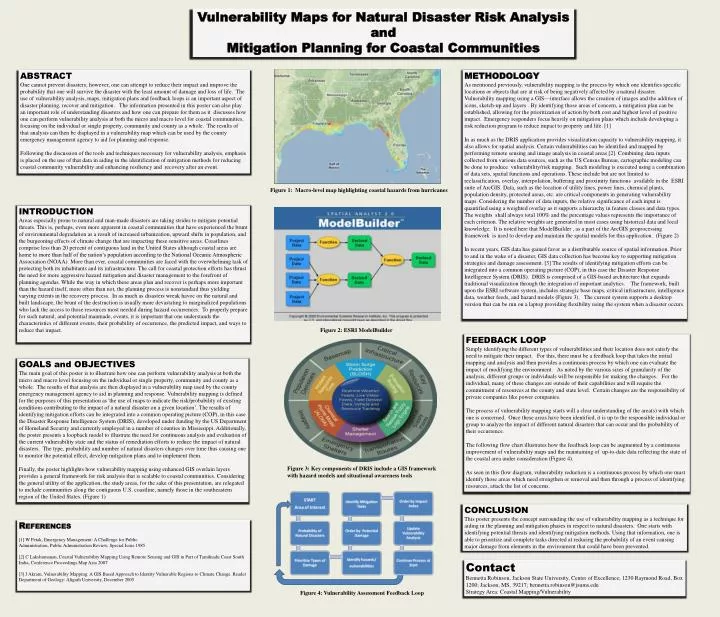
Vulnerability Maps for Natural Disaster Risk Analysis and • Mitigation Planning for Coastal Communities ] ABSTRACT One cannot prevent disasters; however, one can attempt to reduce their impact and improve the probability that one will survive the disaster with the least amount of damage and loss of life. The use of vulnerability analysis, maps, mitigation plans and feedback loops is an important aspect of disaster planning, recover and mitigation. The information presented in this poster can also play an important role of understanding disasters and how one can prepare for them as it discusses how one can perform vulnerability analysis at both the micro and macro level for coastal communities, focusing on the individual or single property, community and county as a whole. The results of that analysis can then be displayed in a vulnerability map which can be used by the county emergency management agency to aid for planning and response. Following the discussion of the tools and techniques necessary for vulnerability analysis, emphasis is placed on the use of that data in aiding in the identification of mitigation methods for reducing coastal community vulnerability and enhancing resiliency and recovery after an event. METHODOLOGY As mentioned previously, vulnerability mapping is the process by which one identifies specific locations or objects that are at risk of being negatively affected by a natural disaster. Vulnerability mapping using a GIS—interface allows the creation of images and the addition of icons, sketch-up and layers . By identifying those areas of concern, a mitigation plan can be established, allowing for the prioritization of action by both cost and highest level of positive impact. Emergency responders focus heavily on mitigation plans which include developing a risk reduction program to reduce impact to property and life. [1] In as much as the DRIS application provides visualization capacity to vulnerability mapping, it also allows for spatial analysis. Certain vulnerabilities can be identified and mapped by performing remote sensing and image analysis in coastal areas [2]. Combining data inputs collected from various data sources, such as the US Census Bureau, cartographic modeling can be done to produce vulnerability/risk mapping. Such modeling is executed using a combination of data sets, spatial functions and operations. These include but are not limited to reclassification, overlay, interpolation, buffering and proximity functions available in the ESRI suite of ArcGIS. Data, such as the location of utility lines, power lines, chemical plants, population density, protected areas, etc. are critical components in generating vulnerability maps. Considering the number of data inputs, the relative significance of each input is quantified using a weighted overlay as it supports a hierarchy in feature classes and data types. The weights shall always total 100% and the percentage values represents the importance of each criterion. The relative weights are generated in most cases using historical data and local knowledge. It is noted here that ModelBuilder , as a part of the ArcGIS geoprocessing framework is used to develop and maintain the spatial models for this application. (Figure 2) In recent years, GIS data has gained favor as a distributable source of spatial information. Prior to and in the wake of a disaster, GIS data collection has become key to supporting mitigation strategies and damage assessment. [3] The results of identifying mitigation efforts can be integrated into a common operating picture (COP), in this case the Disaster Response Intelligence System (DRIS).DRIS is comprised of a GIS-based architecture that expands traditional visualization through the integration of important analytics. The framework, built upon the ESRI software system, includes strategic base maps, critical infrastructure, intelligence data, weather feeds, and hazard models (Figure 3). The current system supports a desktop version that can be run on a laptop providing flexibility using the system when a disaster occurs. Figure 1: Macro-level map highlighting coastal hazards from hurricanes INTRODUCTION Areas especially prone to natural and man-made disasters are taking strides to mitigate potential threats. This is, perhaps, even more apparent in coastal communities that have experienced the brunt of environmental degradation as a result of increased urbanization, upward shifts in population, and the burgeoning effects of climate change that are impacting these sensitive areas. Coastlines comprise less than 20 percent of contiguous land in the United States although coastal areas are home to more than half of the nation’s population according to the National Oceanic Atmospheric Association (NOAA). More than ever, coastal communities are faced with the overwhelming task of protecting both its inhabitants and its infrastructure. The call for coastal protection efforts has thrust the need for more aggressive hazard mitigation and disaster management to the forefront of planning agendas. While the way in which these areas plan and recover is perhaps more important than the hazard itself, more often than not, the planning process is nonstandard thus yielding varying extents in the recovery process. In as much as disasters wreak havoc on the natural and built landscape, the brunt of the destruction is usually more devastating to marginalized populations who lack the access to those resources most needed during hazard occurrences. To properly prepare for such natural, and potential manmade, events, it is important that one understands the characteristics of different events, their probability of occurrence, the predicted impact, and ways to reduce that impact. Figure 2: ESRI ModelBuilder FEEDBACK LOOP Simply identifying the different types of vulnerabilities and their location does not satisfy the need to mitigate their impact. For this, there must be a feedback loop that takes the initial mapping and analysis and then provides a continuous process by which one can evaluate the impact of modifying the environment. As noted by the various sizes of granularity of the analysis, different groups or individuals will be responsible for making the changes. For the individual, many of these changes are outside of their capabilities and will require the commitment of resources at the county and state level. Certain changes are the responsibility of private companies like power companies. The process of vulnerability mapping starts will a clear understanding of the area(s) with which one is concerned. Once these areas have been identified, it is up to the responsible individual or group to analyze the impact of different natural disasters that can occur and the probability of their occurrence. The following flow chart illustrates how the feedback loop can be augmented by a continuous improvement of vulnerability maps and the maintaining of up-to-date data reflecting the state of the coastal area under consideration (Figure 4). As seen in this flow diagram, vulnerability reduction is a continuous process by which one must identify those areas which need strengthen or removal and then through a process of identifying resources, attack the list of concerns. GOALS and OBJECTIVES The main goal of this poster is to illustrate how one can perform vulnerability analysis at both the micro and macro level focusing on the individual or single property, community and county as a whole. The results of that analysis are then displayed in a vulnerability map used by the county emergency management agency to aid in planning and response. Vulnerability mapping is defined for the purposes of this presentation as 'the use of maps to indicate the risk/probability of existing conditions contributing to the impact of a natural disaster on a given location’. The results of identifying mitigation efforts can be integrated into a common operating picture (COP), in this case the Disaster Response Intelligence System (DRIS), developed under funding by the US Department of Homeland Security and currently employed in a number of counties in Mississippi. Additionally, the poster presents a loopback model to illustrate the need for continuous analysis and evaluation of the current vulnerability state and the status of remediation efforts to reduce the impact of natural disasters. The type, probability and number of natural disasters changes over time thus causing one to monitor the potential effect, develop mitigation plans and to implement them. Finally, the poster highlights how vulnerability mapping using enhanced GIS overlain layers provides a general framework for risk analysis that is scalable to coastal communities. Considering the general utility of the application, the study areas, for the sake of this presentation, are relegated to include communities along the contiguous U.S. coastline, namely those in the southeastern region of the United States. (Figure 1) Figure 3: Key components of DRIS include a GIS framework with hazard models and situational awareness tools CONCLUSION This poster presents the concept surrounding the use of vulnerability mapping as a technique for aiding in the planning and mitigation phases in respect to natural disasters. One starts with identifying potential threats and identifying mitigation methods. Using that information, one is able to prioritize and complete tasks directed at reducing the probability of an event causing major damage from elements in the environment that could have been prevented. References [1] W Petak, Emergency Management: A Challenge for PublicAdministration, Public Administration Review, Special Issue 1985 [2] C Lakshumanan, Coastal Vulnerability Mapping Using Remote Sensing and GIS in Part of Tamilnadu Coast South India, Conference Proceedings Map Asia 2007 [3] J Akram, Vulnerability Mapping: A GIS Based Approach to Identity Vulnerable Regions to Climate Change. Reader Department of Geology: Aligarh University, December 2005 Contact Bennetta Robinson, Jackson State University, Center of Excellence; 1230 Raymond Road, Box 1200; Jackson, MS, 39217; bennetta.robinson@jsums.edu Strategy Area: Coastal Mapping/Vulnerability Figure 4: Vulnerability Assessment Feedback Loop